User behavior shifts explain the rise. Hinge now sits among the most-used dating apps worldwide, driven by its Designed to be Deleted positioning. In my practice, I see singles move here when they want something serious. The product avoids swipe-first logic. It pushes longer conversations, intent-based matching. Less noise, more signal. That changes who stays.
The user base has crossed 20 mn and continues to grow, with dense clusters in large cities where app dating dominates. My clients often ask me how many actually find long-term partners. The data gives a clean direction. Adoption patterns and match depth both point to relationship-focused use, not casual browsing.
This 2026 breakdown looks at hinge dating statistics through a practical lens. I believe raw numbers matter only when tied to behavior. So I focus on user structure, match outcomes, daily activity, and premium revenue signals. Gender response gaps, message timing, conversion patterns, even exported user data. All of it. You get a direct view of how the system works under real conditions.
10 Key Hinge Statistics to Know Right Now
- Hinge hosts over 20 million active users worldwide.
- Match Group officially acquired the platform in 2019.
- 90% of the user base falls between the ages of 23 and 36.
- The app sees its highest activity clusters in major metropolitan areas like New York, Los Angeles, and Chicago.
- The signature slogan, “Designed to be Deleted,” remains its core market differentiator.
- Profiles utilizing video prompts receive a massive 50% boost in user engagement.
- The built-in “We Met” feature continuously feeds data back to the algorithm to improve match quality.
- 60% of the user base explicitly identifies as looking for a serious relationship from the start.
- Hinge Premium subscriptions have surged by over 80% in the past two years.
- New York stands out as the app’s most active and popular city in the United States.
User Demographics: Who Am I Matching With?
When examining who actually populates the app, I notice a clear trend: the user base leans heavily toward young professionals who value real intent over casual noise. Urban singles dominate the platform, intentionally looking for relationships that feel authentic rather than getting stuck in endless swiping loops. If you study global hinge demographics, the data proves that this platform attracts a very specific, career-oriented audience.
The Gender Balance
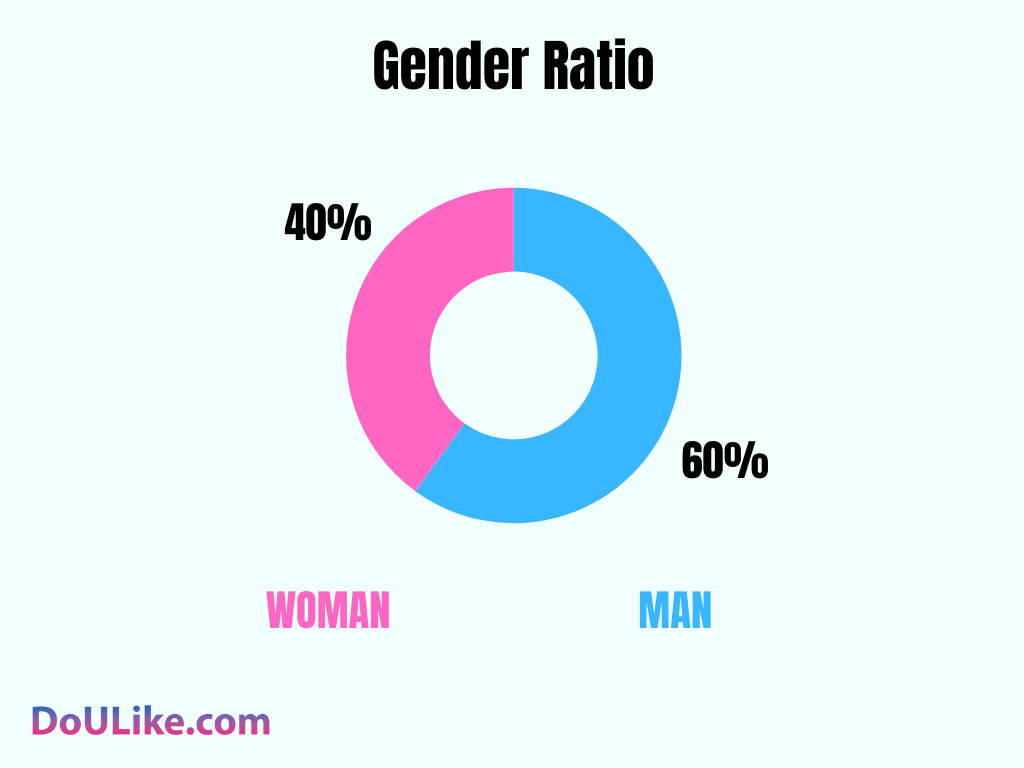
Compared to aggressive competitors like Tinder, Hinge maintains one of the more balanced gender distributions in the industry. However, men still outnumber women. My evaluation of the data shows that approximately 60.36% of users are male, while 39.64% are female, making it one of the more structurally sound environments for interaction. When examining the raw ratio of men to women on Hinge, this 6:4 split provides a much healthier dynamic for both sides than traditional swiping applications.
Age Breakdown
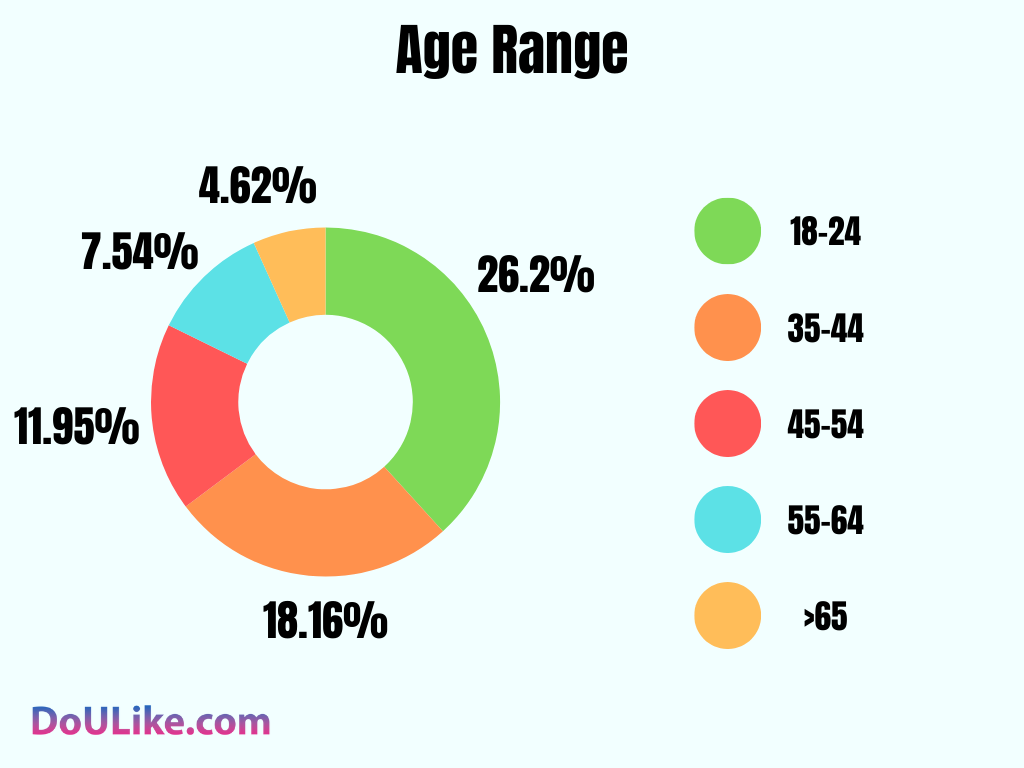

The platform heavily skews toward young adults. The average age of Hinge users sits firmly in the young professional bracket, and the largest cluster is found squarely in the 25–34 age segment, accounting for 31.53% of the total base. When mapping overall usage patterns, this core demographic consistently drives the platform’s daily activity, and analysts continuously map usage patterns to reach the same point—the distribution heavily peaks here while other brackets sit lower and do not compete with that share.
Here is how the rest of the age distribution looks across the app:
- 18–24 years: 26.20%
- 25–34 years: 31.53%
- 35–44 years: 18.16%
- 45–54 years: 11.95%
- 55–64 years: 7.54%
- 65 and above: 4.62%
Relationship Goals & Career Profiles
Hinge intentionally targets people who want a long-term commitment. When evaluating Hinge user statistics, I see a massive tilt: around 87% of users are looking for something serious, while the remaining 13% lean toward casual dating or platonic friendships.
The platform pulls heavily from corporate and professional fields. Finance, tech, healthcare, and media backgrounds show up constantly. In my professional observation, users with visible, higher-paying, or established professional roles tend to attract a higher volume of matches. Job titles and income signals clearly shape perceived desirability, and the community reacts to those markers rapidly.
Geographic Footprint: Where is Hinge Most Popular?
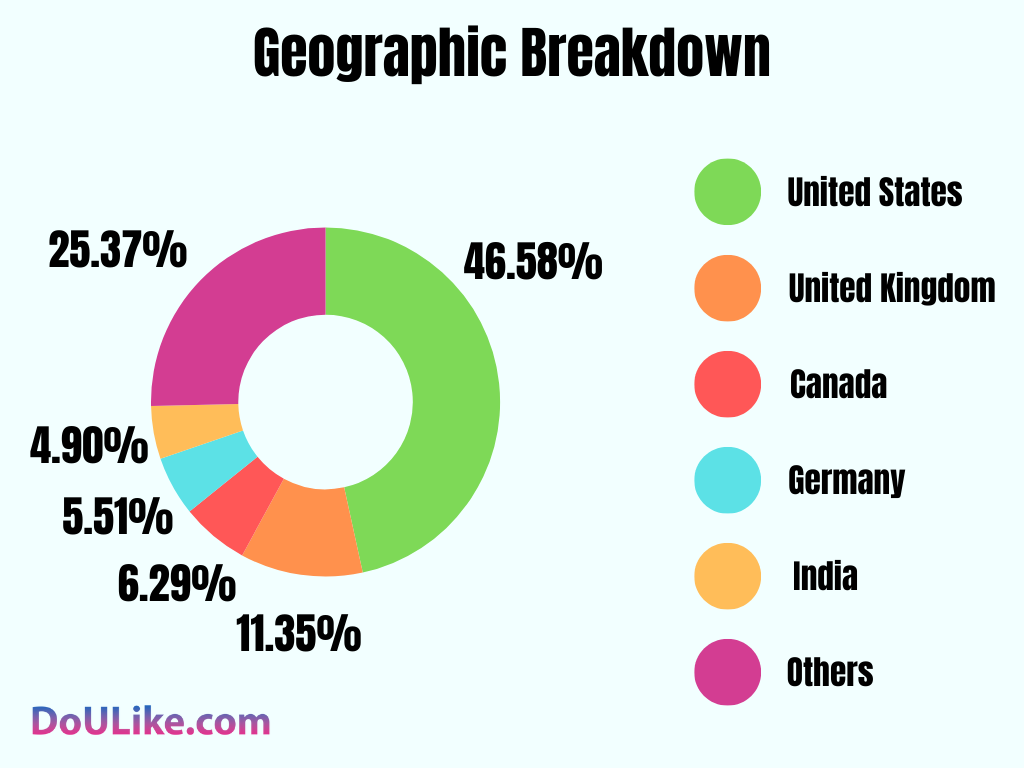
To understand the platform’s reach, we must look at how Hinge users by city aggregate in key areas. While activity is heavily clustered in global hubs like London and Sydney, the macro distribution of users by country highlights a strong Western concentration:
- United States: 46.58% (with U.S. market share increasing to 18.75% by 2023, establishing Hinge as the third-largest dating app in the country)
- United Kingdom: 11.35%
- Canada: 6.29%
- Germany: 5.51%
- India: 4.90%
- Others: 25.37%
Hinge vs. DoULike: A Professional Comparison
While Hinge frames its experience entirely around younger urban professionals and prompt-driven interactions, DoULike takes a fundamentally different approach. It focuses on value-based matching, placing heavier weight on profile quality across a much broader age spread.
When clients ask me which platform to choose, I tell them it depends entirely on their dating priorities. Here is how I stack them up side-by-side:
| Category |   |  |
| Active Users | 20+ million worldwide (approx. 23 million in recent macro cycles) | 1+ million |
| Average Age | 23–36 (core users) | 30–45 |
| Male-to-Female Ratio | ~60% men / ~40% women | More balanced (boosted by free access for women) |
| Relationship Goals | 87% seeking serious relationships | Primarily serious, value-based connections |
| Matching System | Prompt-based profiles + “We Met” algorithm | ValueMatch based on beliefs & life priorities |
| Pricing Model | Freemium + premium tiers (Hinge+ / HingeX) | Free for women; men pay only for messaging |
| Best For | Young urban professionals seeking long-term ties | Singles wanting safer, value-driven dating with deep compatibility |
Hinge Match Statistics
As the demographics show, user distribution peaks completely in the 25–34 age segment. However, what happens after account creation depends heavily on behavior, gender dynamics, and matching expectations.Anyone trying to understand the algorithm must look at the macro Нinge stats to see how likes convert into conversations.
Average Number of Matches for Men
Men report uneven match volumes on Hinge. Profile quality, usage patterns, and city size drive most of the variance, though exact weighting shifts case by case. When analyzing the average number of matches on Нinge, some users land around four matches per week. Others push far higher, or drop that baseline below, depending on how they present themselves and how often they engage.
If you ask how many matches do guys get on Нinge, the answer varies wildly based on optimization. One tracked result shows roughly 4.23 matches weekly across a six-month window. Another case jumps to about 20 matches within a single week.
Average Number of Messages Exchanged Before a First Date
Men and women show clear gaps in acceptance behavior on Hinge. I believe this ties directly to match volume and filtering habits. Data on how many hinge matches per day users receive points to uneven selectivity across genders. Some users swipe fast. Others slow it down, screen harder, and hesitate a bit before making contact.
Hinge Acceptance Rate: How Often Do Users Say “Yes”?
Data on daily match volume points to a sharp gap between male and female acceptance rates on Hinge. Same product, same mechanics, yet the outcomes diverge sharply across genders, which deeply shapes the overall Нinge match rate and how people experience the matching funnel:
- Men report a match-to-like ratio close to 3%, meaning roughly one match appears after sending 33 likes.
- Women show a much higher ratio, around 35%, working out to one match for about every three likes sent.
The Reality Check: What a Hinge Match Funnel Actually Looks Like
Whenever my clients complain that online dating feels exhausting, I use hard data and core Нinge statistics to show them the underlying mechanics. The conversion funnel from a screen to a physical date is stark.
The Reddit Data: The Brutal Path to a First Date
To get a truly unfiltered look at success rates, I regularly analyze user data exported directly from Hinge and discussed in communities like r/HingeStories and r/dataisbeautiful. For example, a standard male user tracking his data over a 90-day period often reports sending over 720 likes, resulting in around 55 matches. Out of those, only 3 or 4 convert into actual first dates. That is roughly a 0.4% conversion rate from a sent ‘like’ to a real-life meeting.
Women experience the exact opposite friction. Female users frequently report receiving hundreds of likes in their queue, but find that filtering through them to establish a genuine, non-flaky connection feels like an exhausting and stressful process.
📊 Profile Audit Case Study from My Practice
- Client: Mark, 29, Financial Analyst (Chicago)
- Before: Sent 86 thoughtful comments over 3 weeks. Received only 2 replies, both resulting in immediate ghosting. Total match rate was below 2.5%.
- The Adjustment: We removed clichéd prompts, activated two 5-second video prompts showing his daily work/hobbies, and restricted his swiping strictly to active profiles with shared values.
- After: Within a month, his response rate on comments rose to roughly 26%, generating steady weekly conversations and leading directly to 2 active second dates.
I always tell my clients not to take ghosting or low initial match rates personally. The data proves it is a systemic numbers game driven by digital swiping dynamics, not a reflection of your worth.
Subscription & Revenue: The Business of Intent
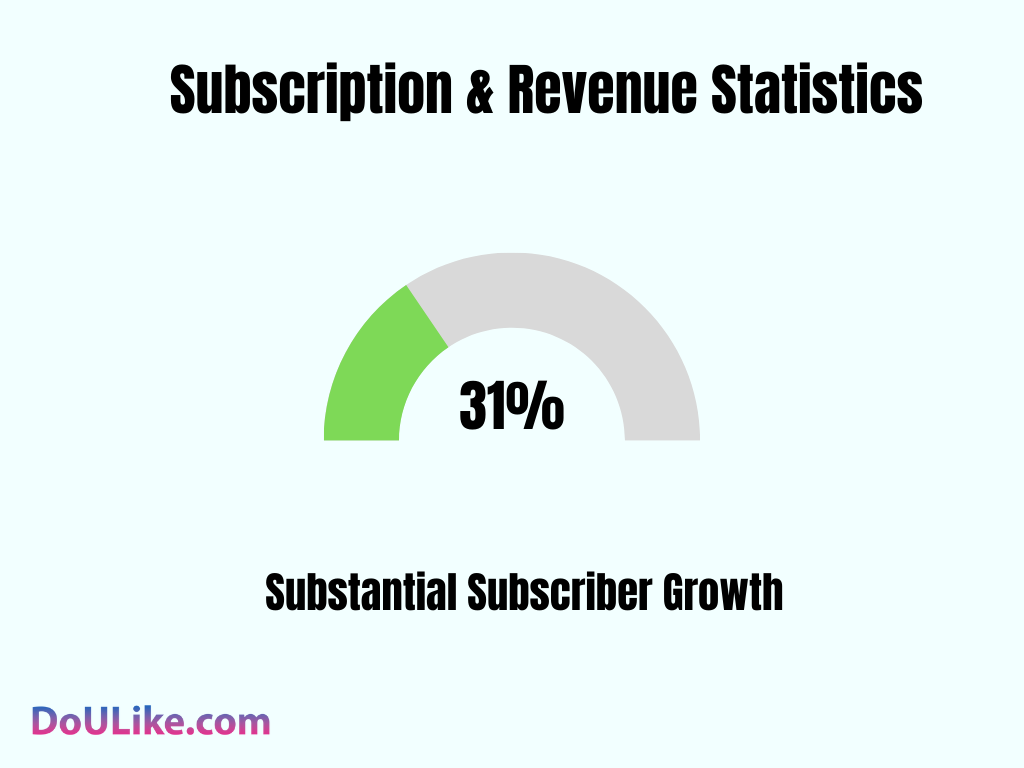
Hinge’s financial growth line shows that users are increasingly willing to pay to bypass the standard limitations of the free tier. The platform reported hitting 1.4 million paying users in early 2024, marking a 31% increase year-over-year from the 1.3 million paying subscribers recorded when the overall user base sat around 23 million.
Breakdown of Subscription Plans and Their Popularity
This financial growth is directly fueled by users upgrading to Hinge’s two distinct tiers:
- Hinge+
- Cost: Varies by subscription length and location. For example, a one-month subscription costs $29.99, a three-month subscription is $59.99, and a six-month subscription is $89.99.
- Features: Provides unlimited likes, the ability to see who likes you, and advanced preference filters.
- HingeX
- Cost: Approximately $49.99 per month.
- Features: All the benefits of Hinge+, alongside enhanced match recommendations, higher visibility and priority in matching, and boosted profiles/likes for increased exposure.
Annual Revenue and Financial Growth Trends
The app’s annual revenue trends illustrate a massive trajectory where the growth line doesn’t wobble:
- 2018: $8 million
- 2019: $31 million
- 2020: $90 million
- 2021: $197 million
- 2022: $284 million
- 2023: $396 million
Pulling in $134 million in Q1 2024 alone (up 48% year-over-year), the platform is rapidly pacing past $500 million and edging toward a $1 billion business scale, proving that the corporate expansion remains incredibly strong.
The Marriage and Divorce Factor: Does Hinge Actually Work?
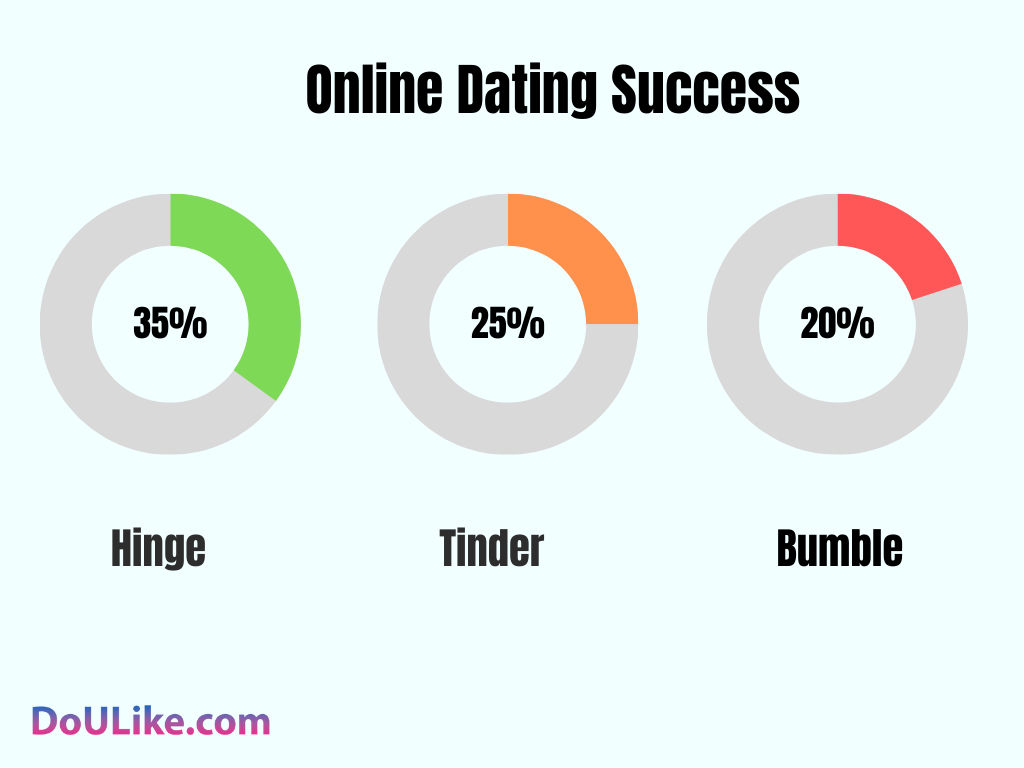
Hinge proudly markets itself as built to be deleted, and data from mainstream matrimonial studies validates a significant part of that pitch. According to The Knot’s Jewelry and Engagement Study, 35% of couples who met through dating apps and subsequently married originally connected on Hinge. For comparison, Tinder accounted for 25% and Bumble for 20%. The gap is real, even if messy to interpret.
When looking at the long-term Нinge success rate, the platform does not publish a hard count of marriages tied to its platform, so you don’t get a clean public number. What you do get are scattered, viral case studies—such as the widely reported timeline of 27-year-old Emmarie Jensen marrying her match McCray just three months after connecting on the app. She posted the timeline on TikTok, and People.com picked it up—fast, almost abrupt.
Step back a bit. Online dating now sits directly in the mainstream. No surprise there. Still, academic research hints that couples who meet online report slightly lower satisfaction in marriage. Studies out of Arizona State University point to unique initial frictions, such as social pressure and weaker shared social networks. Maybe that matters more than the app itself, maybe not.
What About Hinge Divorce Rates?
Clients frequently ask me if relationships built on apps actually survive. The truth is, hard, long-term datasets tracking specific divorce rates for individual dating apps simply do not exist yet. No clear dataset, no consistent tracking.
However, based on my professional observation, Hinge’s product design gives couples a stronger starting point. Because the app forces users to interact with specific prompts, values, and dealbreakers before they even match, it filters for compatibility early on. This doesn’t guarantee a divorce-proof marriage, but the product layout leans heavily toward deeper connection, giving couples a better baseline than platforms built purely on swiping through photos. People arrive with a clearer goal, and they act on it.
How to Outsmart the Statistics: My Tactical Advice
If you look at the 3% average match rate for men or the high volume of dead conversations and feel discouraged, you shouldn’t give up on the platform just yet. Based on my years of auditing dating profiles, you can significantly alter these baseline statistics by making three tactical adjustments:
- Leverage the 50% Video Boost: The data clearly shows profiles utilizing video prompts receive 50% more engagement. I always suggest adding a short video clip because showing your voice, environment, and genuine vibe cuts through digital static instantly.
- Ditch Generic Clichés: If your prompts say you love “tacos, traveling, and the office,” you blend into the background noise. I recommend choosing prompts that serve as highly specific conversation starters, making it easy for the other person to ask a natural question.
- Never Send a Blank Like: Hinge’s mechanic allows you to attach a message to a specific photo or prompt. I have found that sending a targeted, personalized comment instead of a simple ‘like’ multiplies your response rate significantly. Treat the prompt as the start of a conversation, not just a picture to look at.
The Final Verdict on Hinge in 2026
Many singles I work with treat Hinge as the default once they decide to look for something serious. The match funnel feels harsh, honestly. It takes time. Still, the data points in one direction. Users who build sharp profiles, use video, and hold real conversations keep turning matches into long-term relationships offline.
The 2026 numbers make the platform’s position obvious. Hinge holds over 20 mn users worldwide and keeps distance from hookup-focused apps. Gender balance stays fairly even. Young professionals keep joining, and intent levels remain high. That mix keeps it relevant, not just visible.
Sources
- Reddit [1]
- Business of Apps
- Wikipedia
- The Everygirl
- Reddit [2]
- VIDA Select
- Global Dating Insights
- Match
- People.com
I am Linda Bunnell, freelancer and Relationship Expert.
