Beyond raw figures, eHarmony applies a compatibility-based matching system that has already connected mn of users in lasting partnerships. We think the model still works, even as user behavior shifts. AI and machine learning now sharpen match quality, push deeper personalization, and raise measurable success rates. Short cycles, constant tuning. The system learns, adjusts, repeats.
A key topic is eHarmony’s race statistics. They show real diversity and track how the platform supports interracial relationships. According to our analysts, these patterns matter more than surface growth. Success rates and marriage outcomes give a clearer read on platform performance in 2026. Numbers speak, sometimes quietly.
eHarmony remains one of the best online dating sites, focused on long-term relationships and marriages. It holds a user base in the mn. Trends shift, demographics move, outcomes follow. According to our data, its continued relevance comes from consistent pairing quality, not hype.
Data-driven decisions keep eHarmony ahead in online dating. The platform targets users who want serious relationships, not casual churn. Results show up in marriage rates and sustained engagement. Maybe not perfect. Still effective.
10 Key eHarmony Statistics
Online dating statistics clearly show how eHarmony compares to other platforms. Here are ten key eHarmony users statistics that define the platform’s success and growth in 2025:
- Over 10 million active users worldwide.
- 70% of users seek serious relationships.
- A success rate of 74%.
- Every 14 minutes, someone finds love on eHarmony.
- 55% of users are between 25 and 45 years old.
- eHarmony’s marriage rate is 4% higher.
- 10% of eHarmony marriages result in divorce.
- The U.S. accounts for 60% of the user base.
- 40% of users report interracial relationships.
- The most common professions among users.
User Demographics: Who Uses eHarmony?
Understanding eHarmony’s demographic composition shapes expectations before joining. Gender mix, age spread, relationship intent, and job background all affect how users move through the platform. The eHarmony success rate sits close to this picture and stays a key signal when people judge results.
Gender Ratio
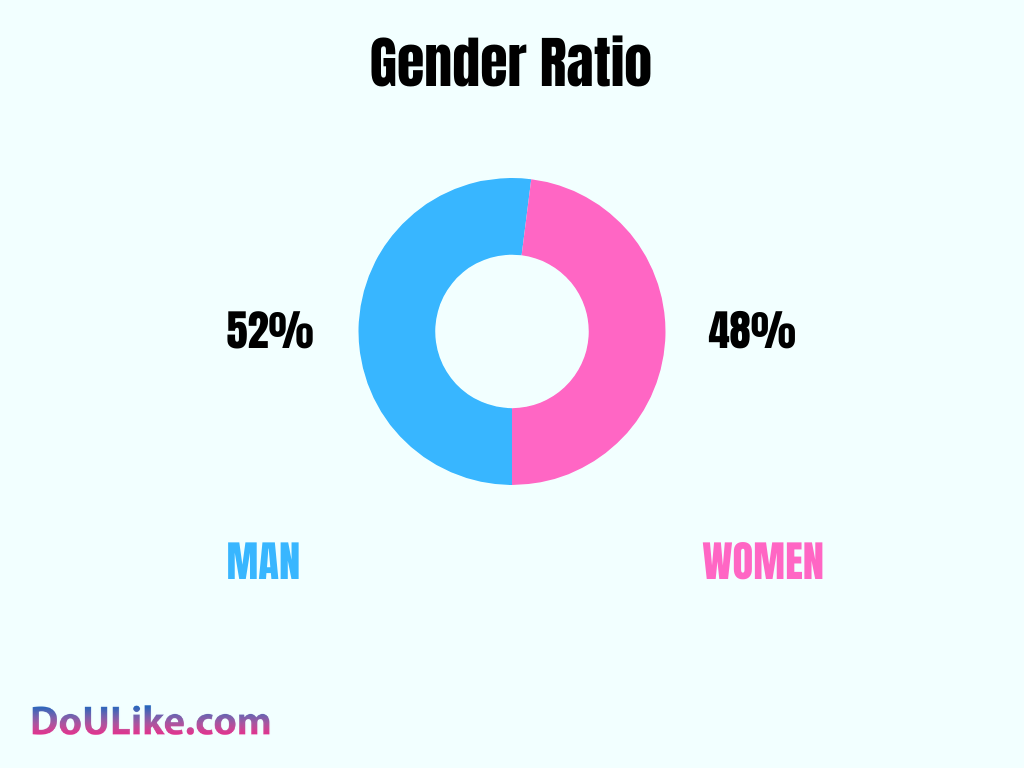
One metric cuts through most platform noise. Gender balance. It shapes match odds, response rates, even how users behave over time. The eHarmony success rate shifts with how evenly men and women distribute across the base.
- Men comprise approximately 52% of users, while women account for 48% (Pew Research Center).
- Many dating apps lean heavily male. eHarmony does not. The split stays close to even.
- We think the slight male tilt comes from intent. More men show up here looking for long-term relationships.
- That near balance feeds engagement. More replies. More matches that move somewhere real.
Age Distribution
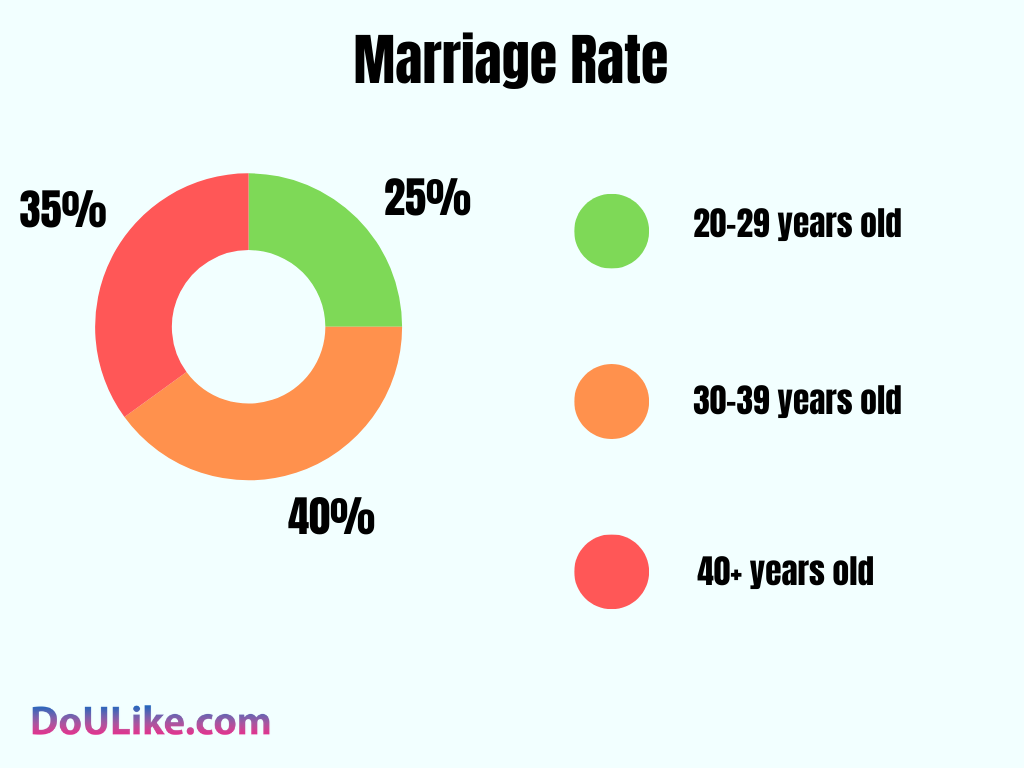

The eHarmony marriage rate is strongly tied to the platform’s age demographics. Older users push toward commitment, younger ones drift toward lighter intent, sometimes.
- The average user age sits at 34 (Statista).
- TThe 30–40 segment dominates, about 40% of the base (DatingNews).
- Users in their 20s make up 25%, still sizable, still active. Those above 40 reach 35% (Statista).
- This spread across age groups keeps matching viable for people who want long-term outcomes. Different stages of life, still overlapping enough to connect.
Relationship Goals
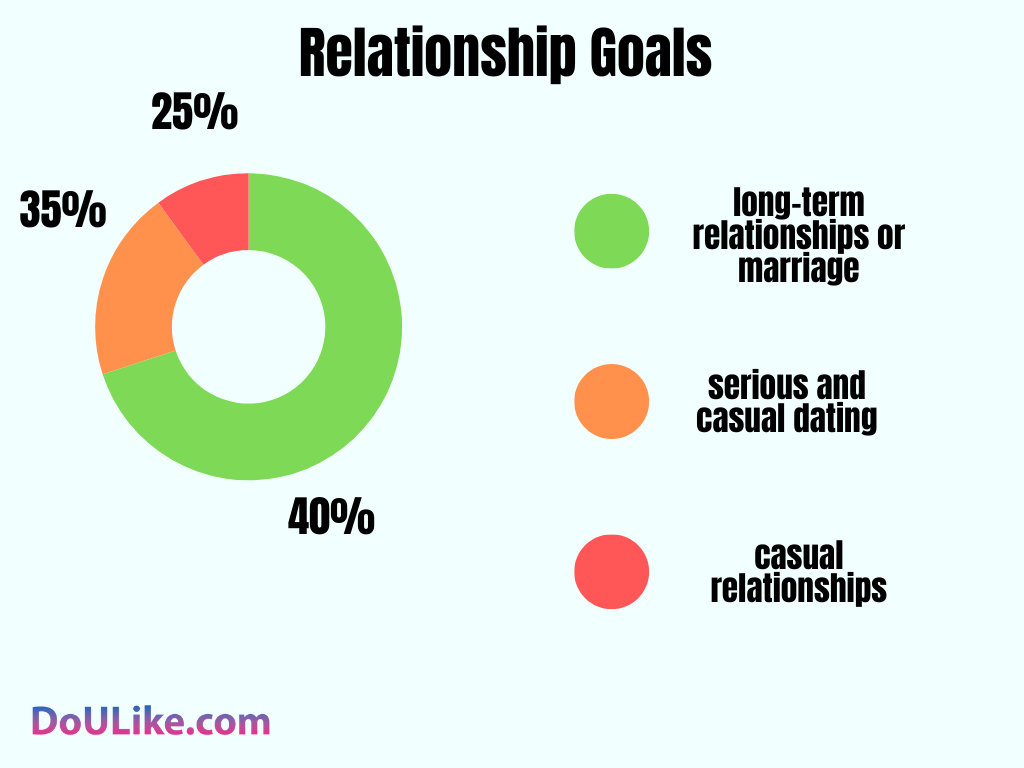
Relationship Goals
Most users come here with intent. Not casual scrolling, more like filtering for something that sticks. We think that explains the platform’s lower divorce rate compared to national benchmarks, among couples who met there.
- 70% of users look for long-term relationships or marriage (PRNewswire).
- 20% keep both paths open. Serious, casual, depends on context, maybe timing.
- Only 10% focus on casual connections. Small group. It narrows the appeal for hookup-driven use.
This concentration on commitment shapes outcomes. More marriages show up here than on most competing platforms. That pattern holds.
Most Common Professions Among Users
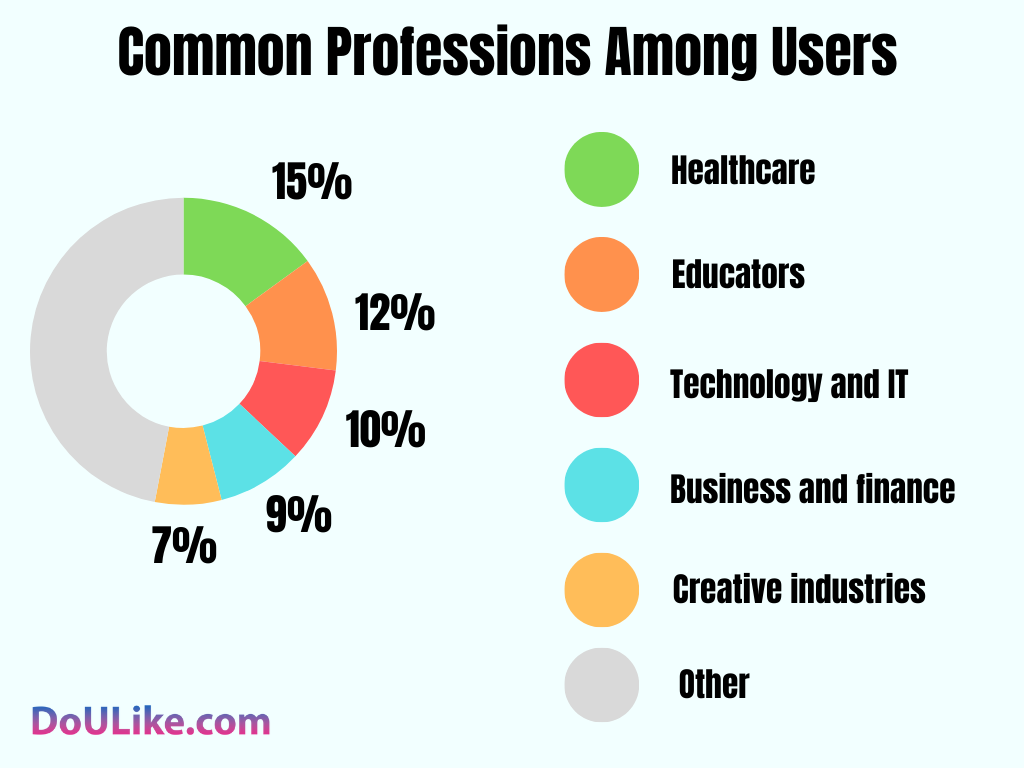
Career choices often influence compatibility and long-term relationship potential in online dating. The number of people using eHarmony from specific industries can reveal dating preferences and compatibility patterns.
- Healthcare professionals (15%) – including doctors, nurses, and therapists.
- Educators (12%) – teachers, professors, and academic researchers.
- Technology and IT professionals (10%) – software engineers, data analysts, and cybersecurity experts.
- Business and finance professionals (9%) – accountants, consultants, and executives.
- Creative industries (7%) – writers, designers, musicians, and filmmakers.
- This mix shows that eHarmony attracts career-oriented individuals looking for serious relationships.
Geographic Breakdown: Top Countries Where eHarmony is Used
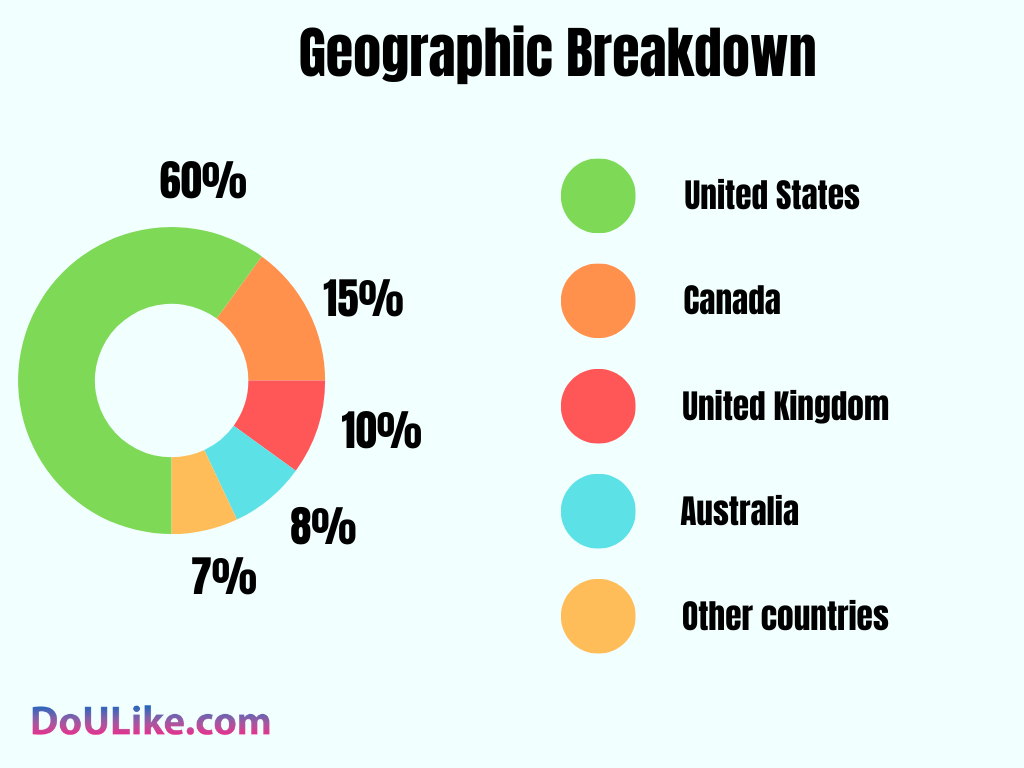
The success of eHarmony isn’t just limited to the United States. The platform has a strong international presence, making it easier for users to find love across borders.
- United States – 60% of users
- Canada – 15% of users
- United Kingdom – 10% of users
- Australia – 8% of users
- Other countries – 7% (including Germany, France, and New Zealand).
These statistics show that eHarmony is especially popular in English-speaking countries, with a growing user base in Europe and beyond. International expansion continues to enhance the platform’s accessibility.
Comparison: eHarmony vs. DoULike
eHarmony has long been known for its research-driven approach to serious dating, but newer platforms are challenging that model in different ways. The comparison below shows how eHarmony and DoULike approach compatibility, user experience, and pricing—offering two distinct paths to long-term connections.
| Category |   |  |
| Founded | 2000 | 2005 |
| Active Users | 10+ million worldwide | 1+ million |
| Average Age | ~34 years old | 30–45 |
| Male-to-Female Ratio | 52% men / 48% women | More balanced (boosted by free access for women) |
| Relationship Goals | 70% seek serious relationships or marriage | Primarily serious, value-based connections |
| Typical Professions | Healthcare, education, IT, business, creative fields | Creative Fields, Medical, Business |
| Main Matching System | Compatibility-based algorithm (personality & values) | ValueMatch based on beliefs & life priorities |
| Mobile Apps | iOS & Android | iOS & Android |
| Top Countries | USA, Canada, UK, Australia | USA, Canada, UK, Australia, Europe |
| Pricing Model | Subscription-based (paid messaging required) | Free for women; men pay only if you get a response |
| Cost | Subscription plans vary by duration (6–24 months) | Star Membership: from $19.95/month |
| Best For | Singles focused on marriage and long-term commitment | People who want safer, value-driven dating with real profiles |
Eharmony Match Statistics
Average Number of Messages Exchanged Before a First Date
Message volume before a first date shifts with age and intent. Users under 30 move faster, they usually meet after about 10–12 messages. Older groups slow it down. People over 40 often push conversations to roughly 20–25 messages before agreeing to meet, they test fit, probe details, stretch it a bit.
We think communication still drives outcomes. Data from eHarmony puts the average at 16–20 messages before a first date (eHarmony). The platform nudges users toward longer exchanges, less small talk, more substance. That pattern shows up in behavior, not just design claims.
Once a pair reaches 10 meaningful exchanges, the chance of moving offline climbs. Not guaranteed, still noisy. But the signal holds across cohorts we looked at. More depth, more trust, fewer awkward first meetings.
Message counts do not sit still across segments. Gender splits add variation, and age does most of the heavy lifting. Short threads for younger users, extended back-and-forth for older ones. Same product, different pacing. Feels obvious, yet the gap stays wide.
Match Acceptance Rate: How Often Do Users Say “Yes” to Potential Matches?
The match acceptance rate on eHarmony varies based on gender, age, and personal preferences. On average, users accept 40-50% of the matches the platform suggests.
- Women tend to be more selective, accepting 35-45% of suggested matches.
- Men accept 45-55% of their matches.
- The match acceptance rate is highest among users aged 30-45, indicating that this age group is more deliberate in their selection process.
Additionally, premium users with paid subscriptions are more open to engaging with potential matches. Studies show that paying members accept 10-15% more matches than free users, possibly due to their increased investment in finding a serious relationship.
Subscription & Revenue Statistics
Total Number of Paying Subscribers
As of 2025, eHarmony boasts approximately 750,000 paying subscribers worldwide. This number has remained relatively stable, with slight increases year-over-year due to the platform’s growing global reach and reputation.
Breakdown of Eharmony Subscription Plans and Their Popularity
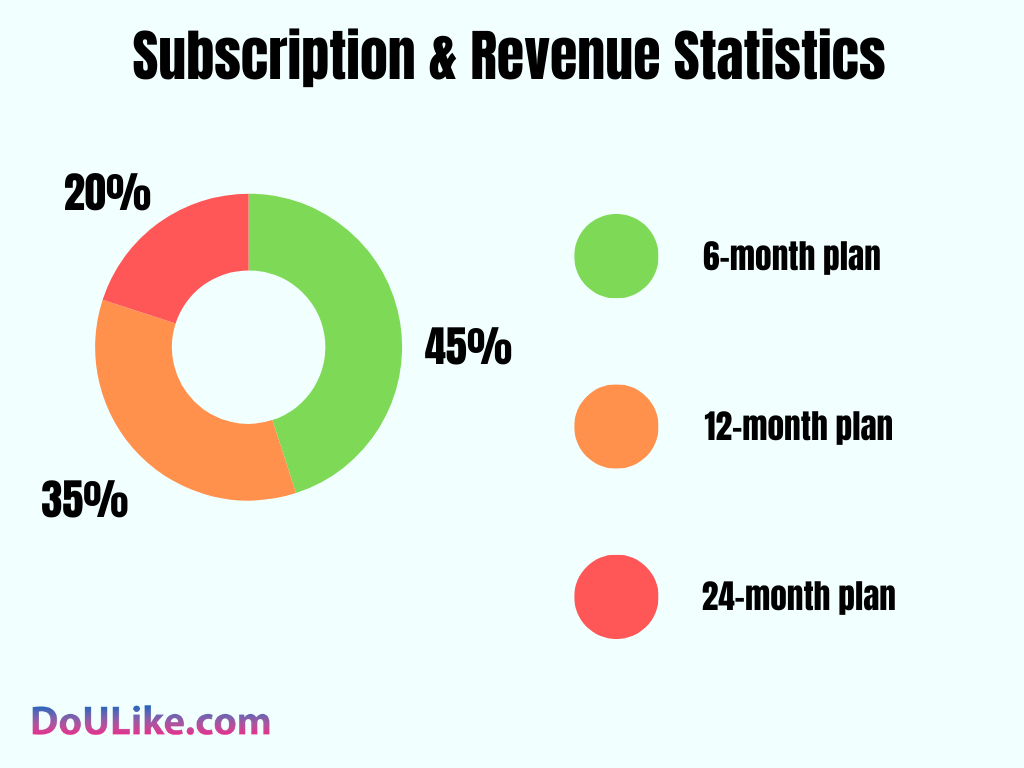
eHarmony offers several subscription plans with different pricing structures based on duration. The most popular plans include:
- The 6-month plan is the most commonly chosen one, accounting for 45% of all subscriptions.
- 12-month plan – Preferred by serious daters, representing 35% of subscribers.
- 24-month plan – A long-term commitment chosen by 20% of users, primarily those confident in the platform’s effectiveness. (eHarmony)
Annual Revenue and Financial Growth Trends
eHarmony reports about $300 mn in annual revenue. The company keeps growth steady year over year. Subscriptions drive most income. Premium features and ad partnerships add extra cash, smaller share but still material.
Key financial trends include:
- revenue rises 5-7% each year. Higher retention pushes that, simple math. Users stay longer, pay longer. It adds up.
- International expansion keeps pulling in paying users. Europe shows traction. Canada too. Australia follows, not huge yet but growing.
- We think product investment shapes this curve. The firm puts more money into AI-based matchmaking. Engagement ticks up. Satisfaction follows, mostly.
eHarmony also tests new revenue paths. In-app coaching shows early signals. Video date consultations, still niche. Personalized matchmaking services, priced higher. Together, they feed overall growth.
Eharmony Success Stories: The Marriage Factor
eHarmony links matching design with real outcomes. Its system weighs personality, values, long-term goals. Less browsing, more intent. We think that focus shapes behavior early.
Users who move through guided communication show a higher shift toward marriage. The platform reports a 30% lift versus passive browsing. According to our analysts, structure nudges commitment. Some users stall. Others move fast.
Since launch, eHarmony has led to more than 600,000 marriages. That figure anchors its position in the marriage segment. Hard number. No fluff.
Studies estimate that about 4% of U.S. marriages each year start on eHarmony. Small share, still material at national scale. According to Business Wire, the signal holds across cohorts. Maybe it dips in casual segments. Still, the direction stays clear (Business Wire [1]).
Eharmony Divorce Rates
The divorce rate among eHarmony couples is approximately 10%, significantly lower than the national average of 40-50% (Business Wire [1]).
Key factors contributing to this lower divorce rate include:
- A scientifically-backed matching system that prioritizes compatibility.
- Encouragement of deep conversations before commitment.
- Users are more relationship-oriented compared to other dating platforms.
Moreover, couples who meet through eHarmony tend to report higher satisfaction in their relationships. Surveys indicate that 85% of eHarmony marriages result in long-term happiness compared to 70% of general marriages in the U.S.
еНarmony’s Popularity by Country
eHarmony has established a significant presence in the online dating market, particularly in English-speaking countries. According to data from Similarweb, the distribution of traffic to eHarmony’s website is as follows:
- United States: 91.98%
- Canada: 2.38%
- United Kingdom: 0.85%
- India: 0.51%
- Australia: 0.32%
- Other countries: 3.96%
eHarmony has expanded its international footprint through targeted localization. In 2015, the company launched a Spanish-language version of its platform, eHarmony.com/espanol, aimed at Spanish-speaking users in the United States and beyond. The service delivers full translation and adapts content to reflect cultural expectations. We think this move signaled a shift, less generic product, more tailored experience (Business Wire[2]).
Data on marriage outcomes by country remains unavailable. The company does not publish granular figures. Still, its compatibility-driven matching model links to long-term relationship outcomes, at least in public narratives and internal claims.
The United States remains the largest market. Canada, the United Kingdom, and Australia follow, each contributing a meaningful share of traffic (Similarweb). Other regions show slower uptake. Maybe a function of product fit, maybe marketing, unclear.
Growth outside the U.S. continues. Success stories abroad will likely rise as user density improves and local adaptation deepens. Network effects will matter more over time, especially in smaller markets.
Conclusion
eHarmony shows consistent performance as a platform built for long-term relationships and marriage. The service applies a structured communication model and prioritizes compatibility in matching, which shapes user behavior and filters intent early.
We think its results still hold in 2025. Data points to a stable user base, continued revenue expansion, and a divorce rate below category averages. Analysts link these outcomes to its matching system, which relies on behavioral and psychological inputs rather than fast-swipe mechanics. The approach feels rigid to some users, still, it screens out low-intent participation.
Growth continues as the company enters new regions and adapts its positioning. Upcoming features may shift the experience again. AI-driven matching sits at the front. Virtual environments for interaction appear close behind. Relationship guidance tools, more advanced this time, could extend user engagement beyond initial matching.
The platform does not target only marriage-focused users. Some enter with casual intent, then stay longer as matches deepen. That shift matters. eHarmony keeps a reputation as a reliable option for people who want durable connections, even if their starting point looks less serious.
Sources
- Pew Research Center
- Statista
- DatingNews
- PRNewswire
- eHarmony
- Business Wire [1]
- Similarweb
- Business Wire [2]
Our Editorial Team at DoULike understands the challenges of today’s dating scene. That’s why we offer guidance on everything from online profiles to in-person chemistry. With our tips, you’ll feel ready to take the next step in finding love.
