Weddings still rank among life’s most meaningful celebrations. Each year mn of couples gather with family and friends to mark a shared commitment. Traditions still guide many ceremonies. But planning styles look very different today. Couples marry later than previous generations, shape highly personal ceremonies, and weigh tradition against strict budget math. And the wedding industry grew into a massive global event sector that tracks spending patterns, vendor demand, and shifting consumer habits.
Wedding statistics help couples plan smarter events. Hard marriage numbers reveal guest trends, cost pressure, and shifting relationship timelines. Our data suggests modern weddings now reflect economic reality as much as romance. Guest lists shift. Vendor spending changes. Cultural expectations move too.This guide examines the most relevant 2026 wedding statistics: costs, guest counts, demographics, engagement timing, vendor budgets, and clear generational differences. Our analysis tracks how couples plan, spend, and prioritize vendors across shifting age groups.
Key Wedding Statistics for 2026
Average cost
$34,000
In the United States
Guest Count
117
Average per wedding
Cost per Guest
$284
Average spend
Popular Month
October
Top wedding month
Vendors
13
Average hired by couples
Venue Cost
$12,200
Average venue price
Planning Timeline
12–18 m
Typical planning time
Wedding Industry
$100B+
U.S. market size
Annual Marriages
2.04M
Per year in the U.S.
Global Wedding Statistics
The dynamic nature of relationships and marriages gives rise to new customs and social expectations every year.
There is no single global database tracking every ceremony worldwide. However, demographic estimates suggest that around 40–45 million weddings take place globally each year, which equals roughly 115,000 weddings every day.
These numbers demonstrate how deeply marriage traditions remain embedded in social life across cultures.
| Metric | Estimated Number |
|---|
| Global weddings per year | ~42 million |
| Daily weddings worldwide | ~115,000 |
Source: United Nations demographic estimates; Wedding Report.
Marriage Trends
Marriage remains one of the most common long-term relationship structures in many countries, although patterns have shifted significantly over time.
Approximately 51% of U.S. adults are currently married, compared with 58% in 1995.
Meanwhile, cohabitation without marriage has increased significantly.
The gradual decline reflects changing social priorities, including career development, financial stability, and evolving attitudes toward long-term partnerships.
| Year | Married Adults |
|---|
| 1995 | 58% |
| 2024 | 53% |
| 2026 | ~51% |
Source: Pew Research Center.
Average Age at First Marriage
One of the most noticeable demographic changes is the age at which people marry.
| Year | Men | Women |
|---|
| 1960 | 23 | 20 |
| 1990 | 26 | 24 |
| 2026 | 30 | 28 |
Source: Pew Research Center.
People today marry later due to:
- longer education
- career development
- financial stability
- changing social expectations
Engagement Statistics
Engagement trends reveal how couples transition from dating to marriage in 2026. Couples today often spend several years building their relationship before getting engaged.
- Average engagement length: 15 months
- 72% of couples live together before marriage
- 60% of proposals are planned months in advance
- $5,500 average engagement ring cost
- 40% of proposals happen during holidays
Wedding statistics 2023 show that there has been a change in how weddings are planned:
- 3.25 years is an average time couple date before engagement
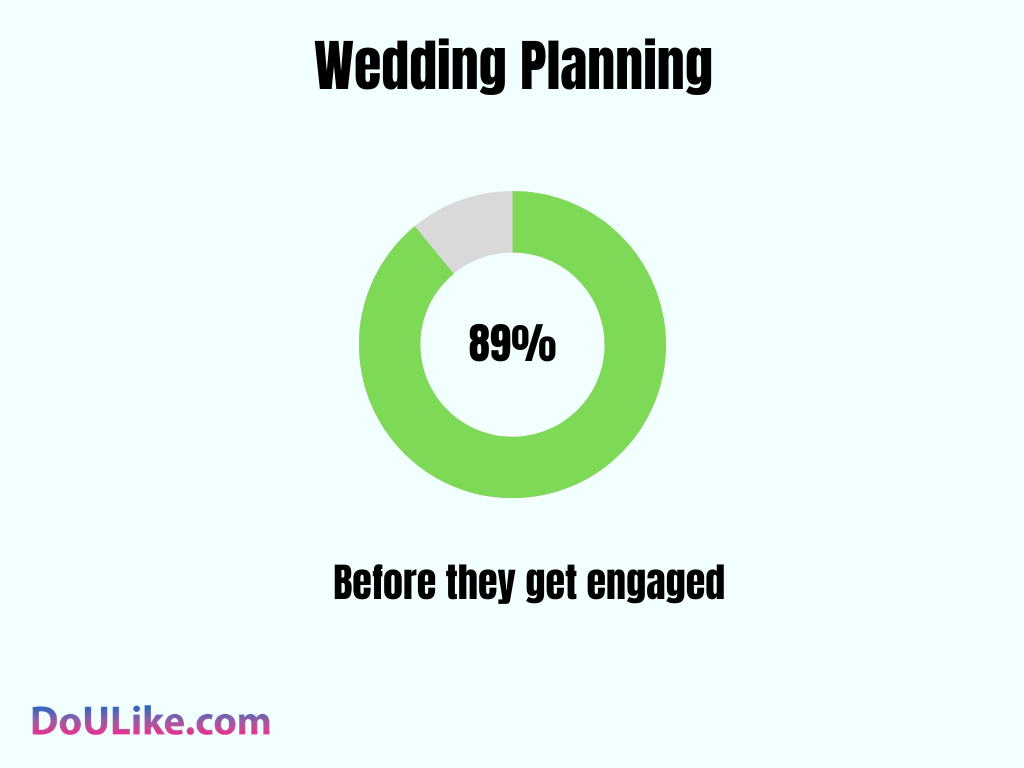
- 89% of couples start wedding planning before proposal
Proposal Statistics
Proposal traditions continue evolving as couples seek memorable experiences.
- December is the most popular proposal month
- Christmas Day is the most popular proposal day
- 40% of proposals involve travel
- 20% occur during vacations
Public proposals and creative experiences have become increasingly popular thanks to social media.
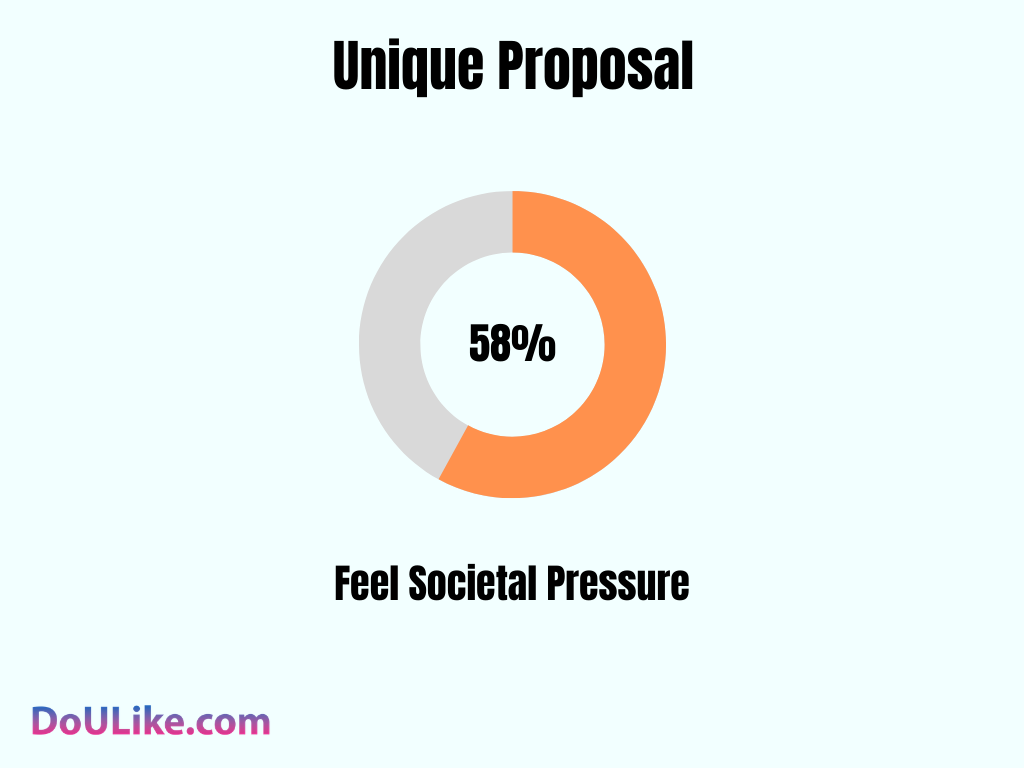
For comparison, in 2023 58% of people feel societal pressure to plan a unique proposal

Average Cost of Weddings
Wedding costs have increased steadily due to inflation and rising vendor demand.
Average wedding cost over time
| Year | Average Cost |
|---|
| 2010 | $24,000 |
| 2015 | $28,000 |
| 2020 | $28,000 |
| 2024 | $33,000 |
| 2025 | $34,000 |
| 2026 | ~$36,000 projected |
Sources: The Knot Real Weddings Study; Zola First Look Report.
Median Wedding Cost
Median wedding cost statistics in 2026 varies depending on dataset.
This indicates many couples host weddings significantly below the national average.
| Dataset | Median Wedding Cost |
|---|
| Zola survey | ~$20,000 |
| Wedding Report | ~$16,000 |
| Small wedding surveys | ~$10,000 |
Source: Civic Science.
37% plan to spend less than $10,000 in 2023 on their wedding
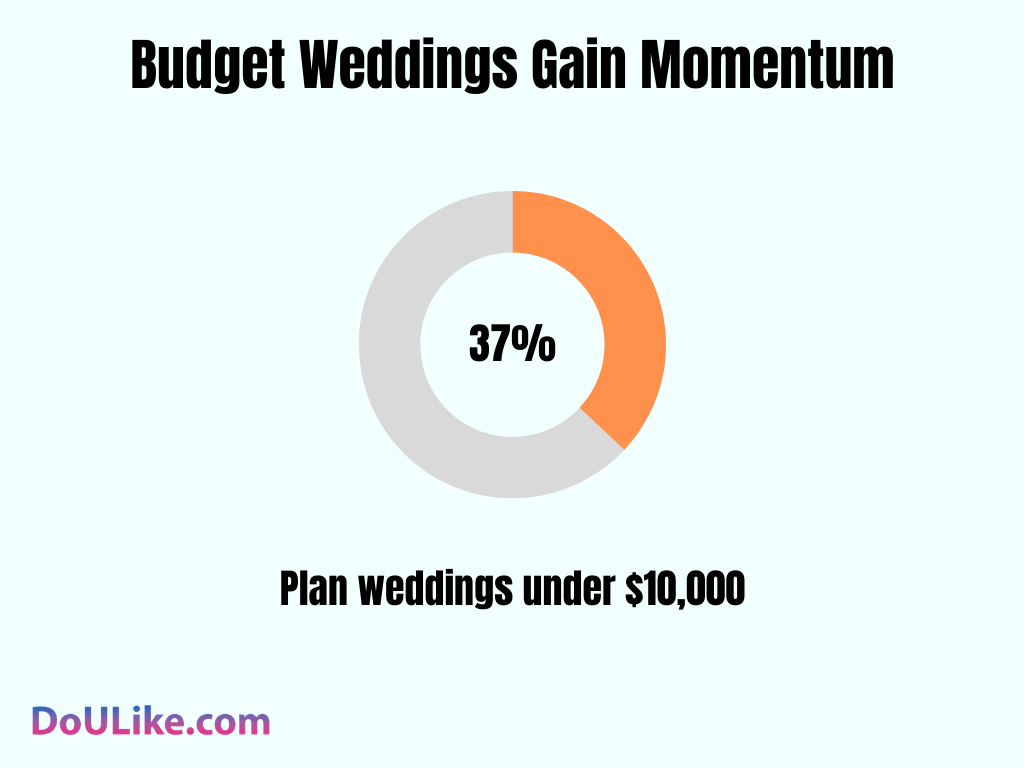
With a shift towards modesty and possible financial prudence, 37% of couples plan weddings costing less than $10,000. These budgets challenge industry norms and show how varied the economic backgrounds and priorities of today’s brides and grooms can be.
Wedding Cost Breakdown
Venue and catering together typically represent 40–50% of total wedding spending statistics.
| Category | Average Cost |
|---|
| Venue | $12,200 |
| Catering | $6,900 |
| Photography | $2,900 |
| Flowers | $2,723 |
| Videography | $2,300 |
| DJ / Entertainment | $1,700 |
| Wedding Cake | $540 |
| Hair & Makeup | $290 |
Source: The Knot Real Weddings Study.
Cost Per Wedding Guest
The average cost per wedding guest is approximately $284, though planners estimate a realistic range of $250–$350 per guest.
Guest list size remains the largest factor influencing wedding budgets.
Budget Examples
| Guests | Estimated Budget |
|---|
| 80 | $22,000 |
| 120 | $34,000 |
| 150 | $42,000 |
Source: NerdWallet wedding cost analysis.
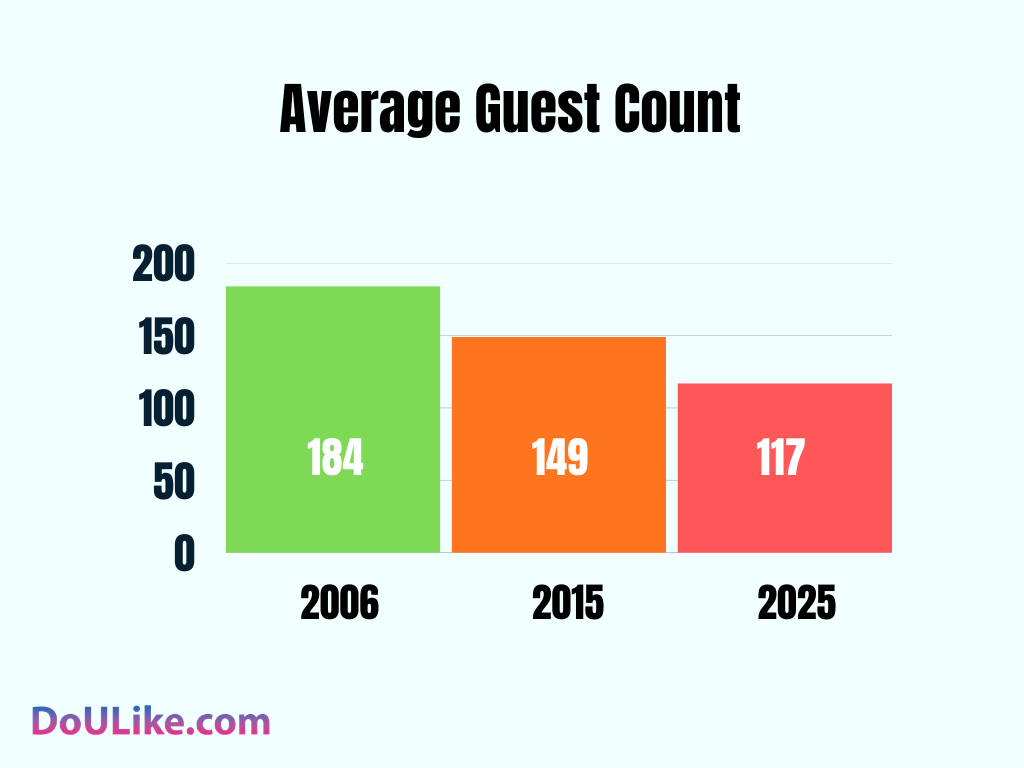
Wedding Guest Count Trends
Guest counts have declined over the past two decades.
About 15–20% of weddings now include fewer than 50 guests, reflecting the rise of micro-weddings.
Here are trends broken down: to illustrate the extent to which individuals are celebrating with couples at various styles of weddings in 2023-2024:
115 Was the Average Wedding Guest List Size in 2023
How many weddings in 2023 had many guests? The average wedding in 2023 had 115 guests. This number strikes a chord between being cozy and fun. Couples can celebrate with lots of friends—and family—without feeling like they’re at a major event they have to host!.
20% of Invited Guests Typically Decline
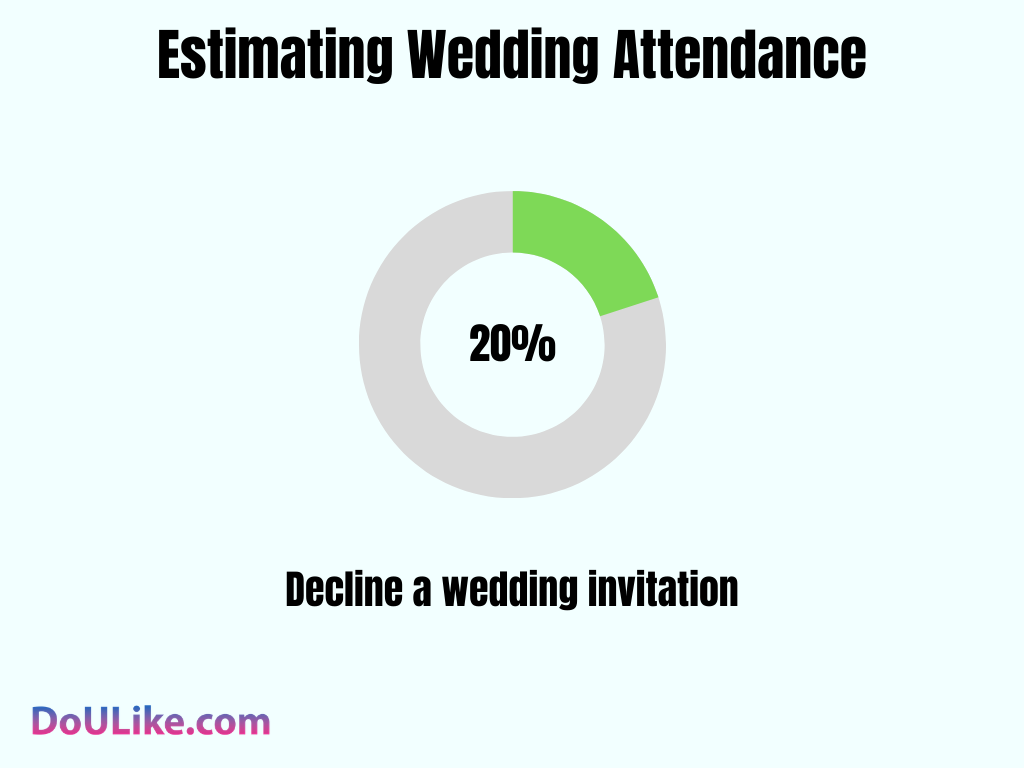
When couples send out wedding invitations, they can expect that approximately 20% of the people they invite will decline. Knowing this average decline rate allows couples to estimate better how many individuals will ultimately show up on the big day. As such, they can more accurately plan for necessary logistics like seating, catering, and rentals.
13% of Couples Keep It Cozy With 1-50 Guests
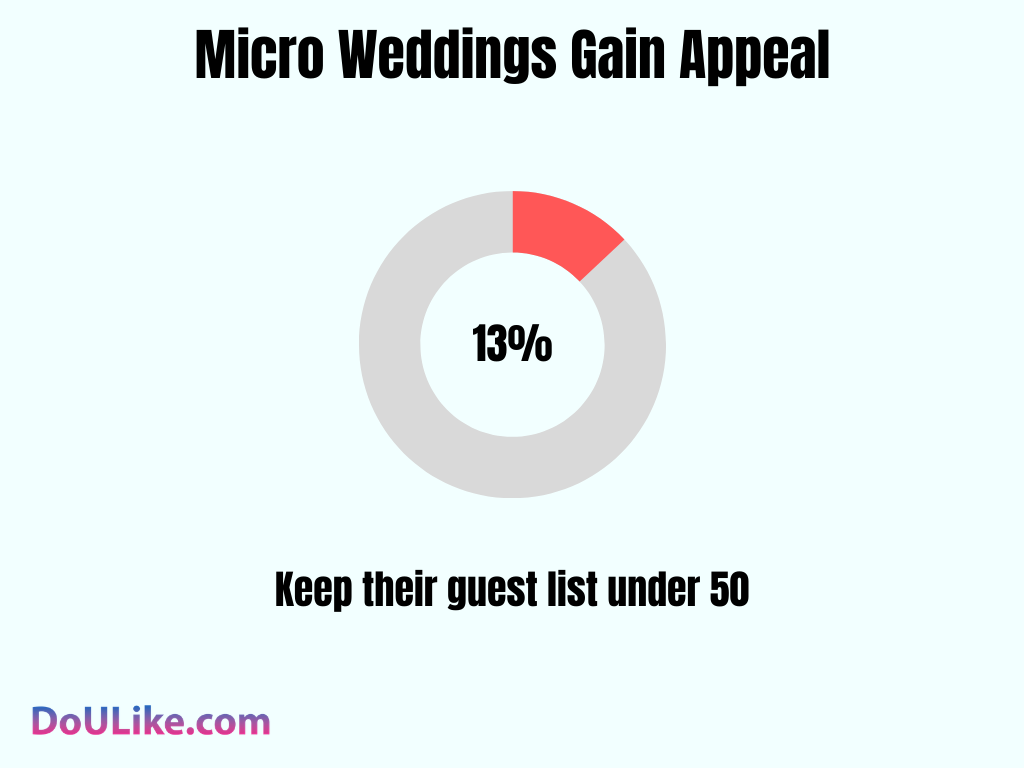
13% of couples prefer intimate settings and keep their guest list under 50. This option enables them to have more personal interactions and provide detailed attention to each guest—things that can be harder to do at larger gatherings. Smaller guest lists may also reflect budget constraints or venue limitations.
Vendor Hiring Statistics
Couples typically hire about 13 wedding vendors.
Most commonly hired vendors:
| Vendor | % of weddings |
|---|
| Photographer | 90% |
| DJ / Band | 80% |
| Florist | 75% |
| Videographer | 45% |
| Wedding planner | 30% |
Source: The Knot vendor statistics.
State-by-State Wedding Costs
Wedding costs vary widely depending on location.
Most Expensive Locations
| Location | Average Wedding Cost |
|---|
| Washington DC | ~$70,000 |
| New Jersey | ~$57,000 |
| New York | ~$53,000 |
| California | ~$42,000 |
Source: Wedding Report; regional cost analyses.
More Affordable States
| Location | Average Wedding Cost |
|---|
| Utah | ~$19,000 |
| Idaho | ~$20,000 |
| Iowa | ~$22,000 |
Source: Wedding Report; regional cost analyses.
Destination Wedding Statistics
Destination weddings remain popular.
Key statistics:
- 25% of couples consider destination weddings
- Average destination wedding cost: $39,000
- Average guest count: ~80 guests
Popular destinations include:
- Mexico
- Hawaii
- Italy
- Caribbean islands
Popular Venues and Locations in 2022-2024
Let’s discover the locations where contemporary couples decide to mark their affection, as well as the reasons these places have stolen their hearts:
63% Prioritize Personalization in Venue Selection
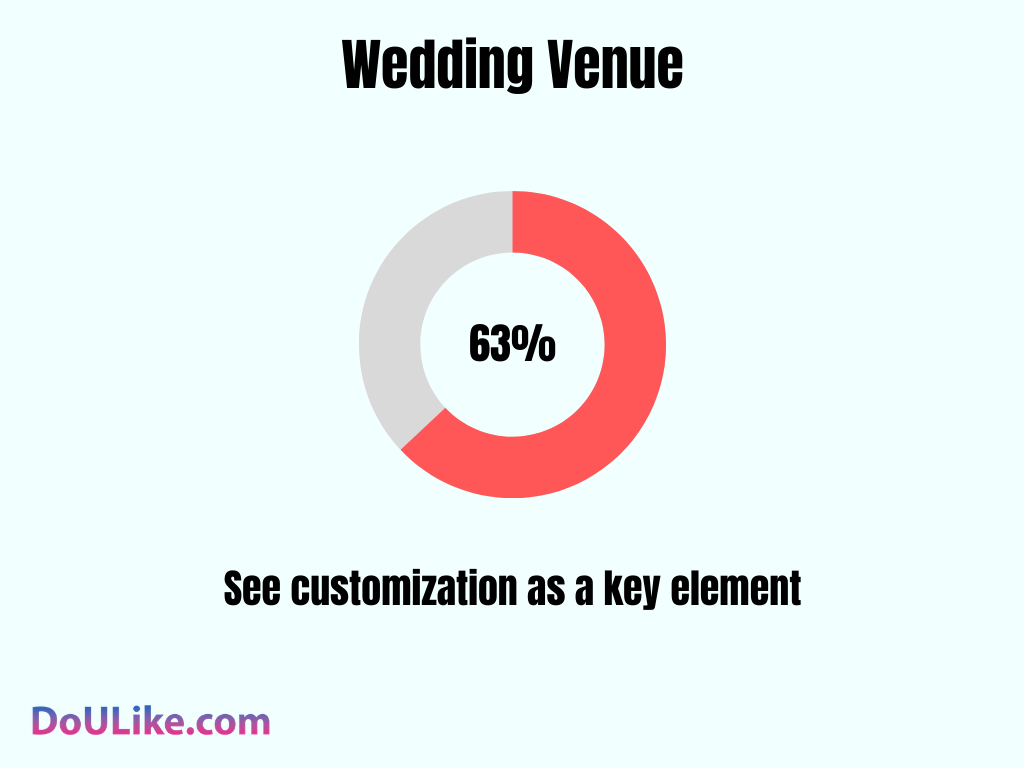
A substantial 63 percent of partners consider customization a key element in choosing their wedding venue—as they want to be able to tailor it to their vision. It’s not only important what the place looks like but also whether they can make it “theirs”.
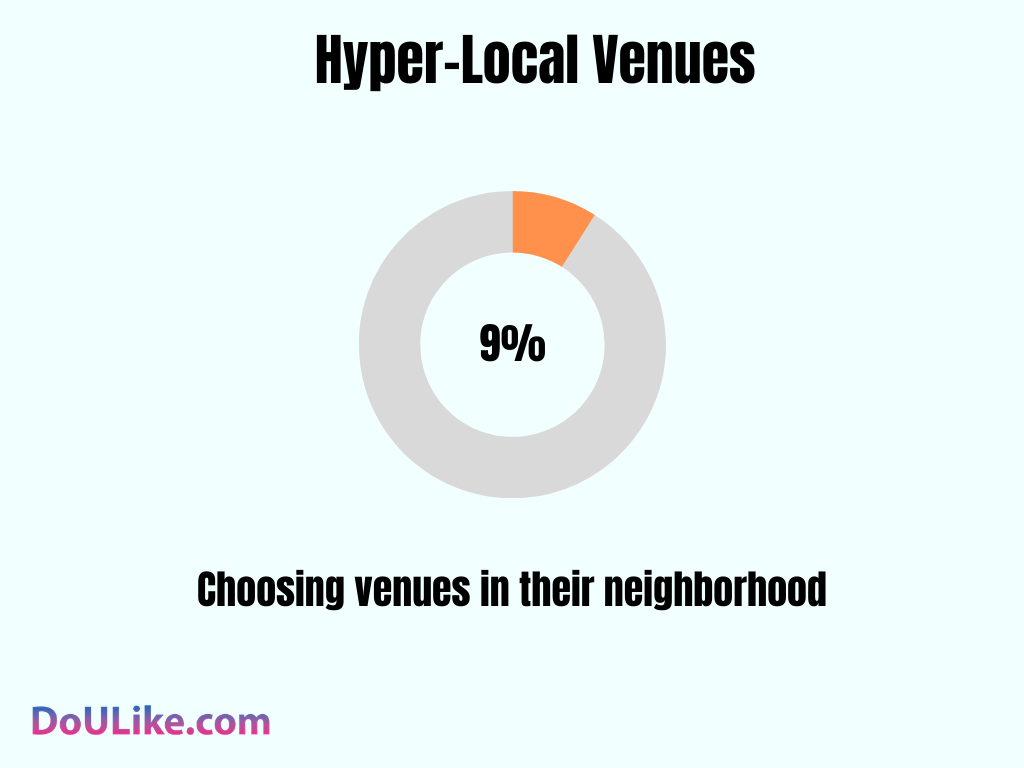
8.84% Opt for Hyper-Local Venues
Almost 9% of couples opt for ultra-local weddings by choosing venues in their neighborhood or near most of their guests. This underscores how much they prioritize convenience and want to throw community-focused celebrations; places with small-town charm mean something special to them.
80,000 Couples Chose Las Vegas For Their Nuptials In 2022
Las Vegas remains attractive to couples – according to wedding industry statistics 2022, about 80,000 went there to get married. The figure shows how well the city keeps its title of being a top place for weddings; it is easy, with lots of fun things going on. You can choose from various weddings at multiple prices.
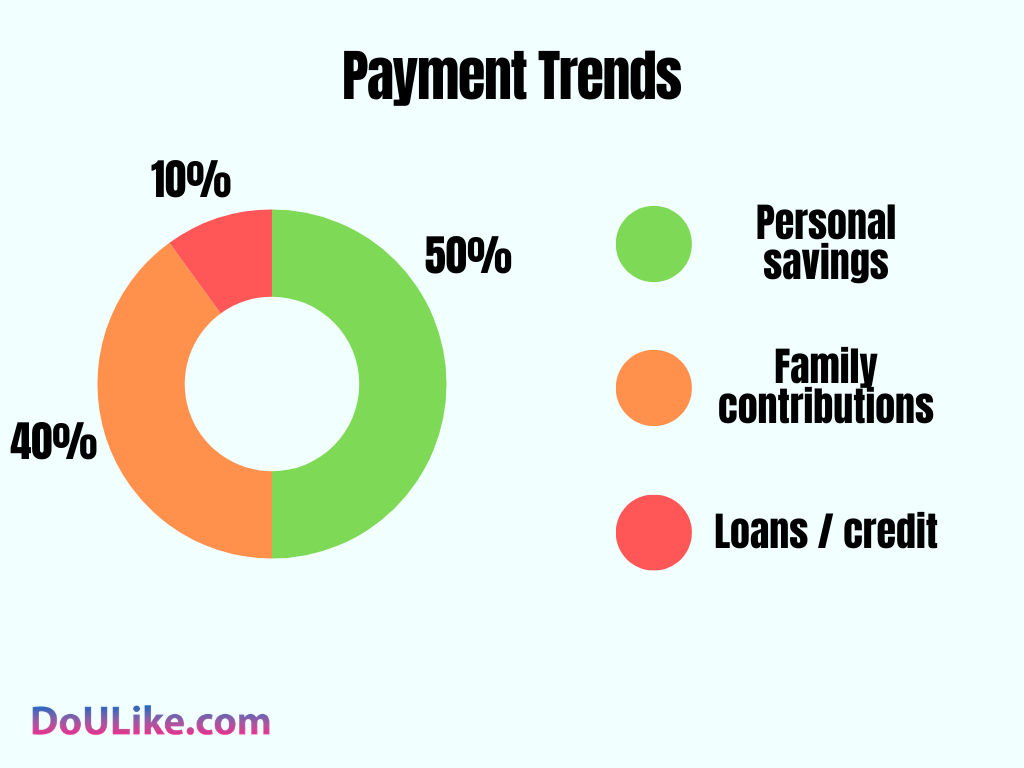
Wedding Spending and Payment Trends
How couples pay for weddings:
| Payment Source | Share of couples |
|---|
| Personal savings | ~50% |
| Family contributions | ~40% |
| Loans / credit | ~10% |
Source: Hitched Wedding Survey.
57% of Couples in 2024 Pay Through Their Checking Account.
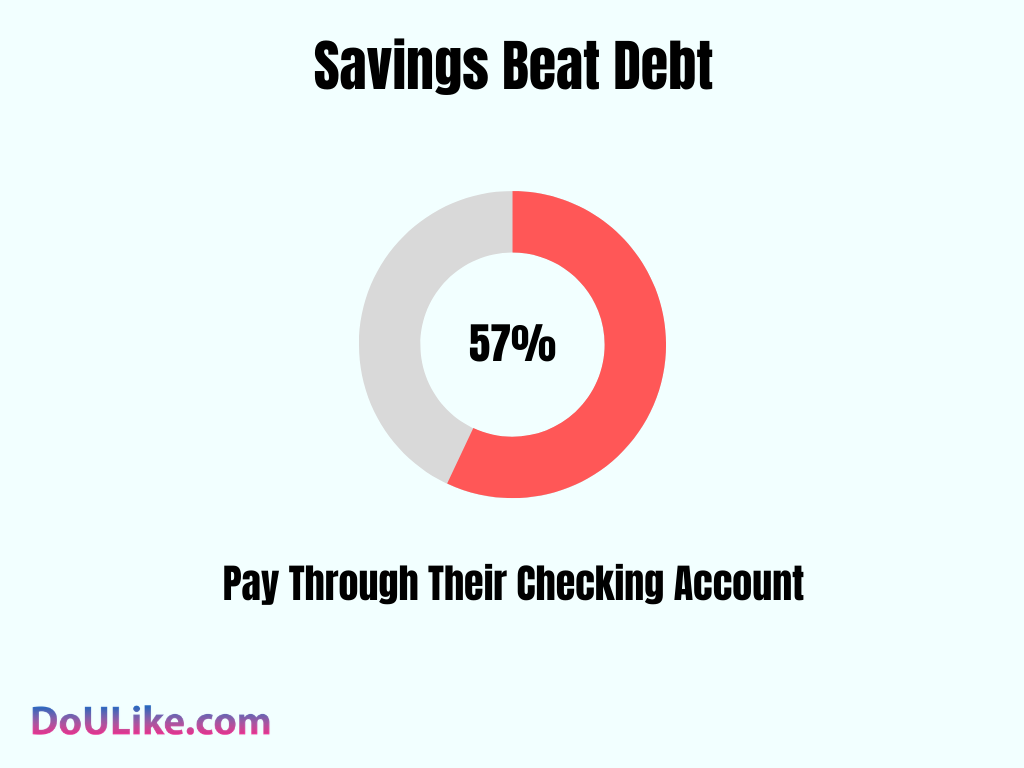
Over 50% of couples use money from their checking accounts to pay for their weddings instead of going into debt. This simple strategy demonstrates how people are taking control over the cost of a major life event.
Popular Wedding Timing
December is the most common engagement month.
Most Popular Wedding Months
| Month | Rank |
|---|
| October | #1 |
| September | #2 |
| June | #3 |
Source: The Knot Real Weddings Study.
Wedding Planning Timeline
Typical wedding planning timeline:
- Engagement
- Venue booking
- Vendor hiring
- Guest list creation
- Invitations
- Final coordination
Average planning time: 12–18 months.
Top Spending Categories in 2024
Let’s investigate the regions in which the most generous allocation of budgets is and the trends that drive these decisions:
61% Invest in Photo Booths For Guest Entertainment
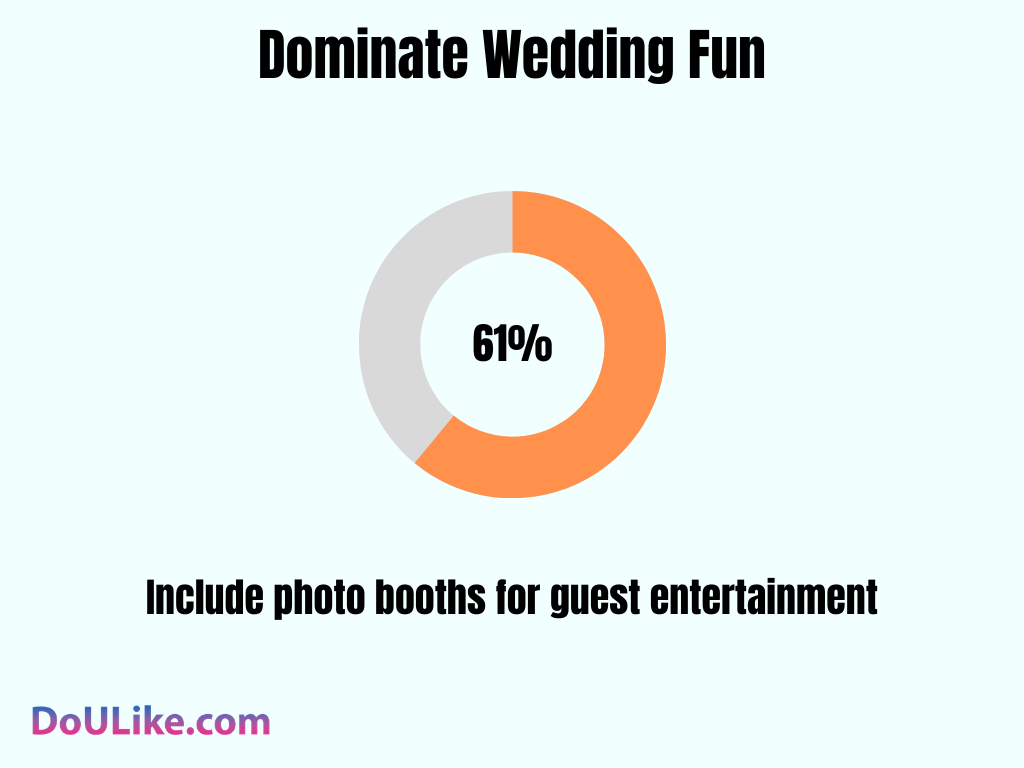
Including photo booths as guest entertainment adds a playful touch to receptions—a choice made by 61% of couples. This option is a growing trend: it gives personalized mementos alongside fun interactions, showing how weddings are becoming more experiential with interactive elements.
30% of Couples Incorporate Eco-Friendly Elements
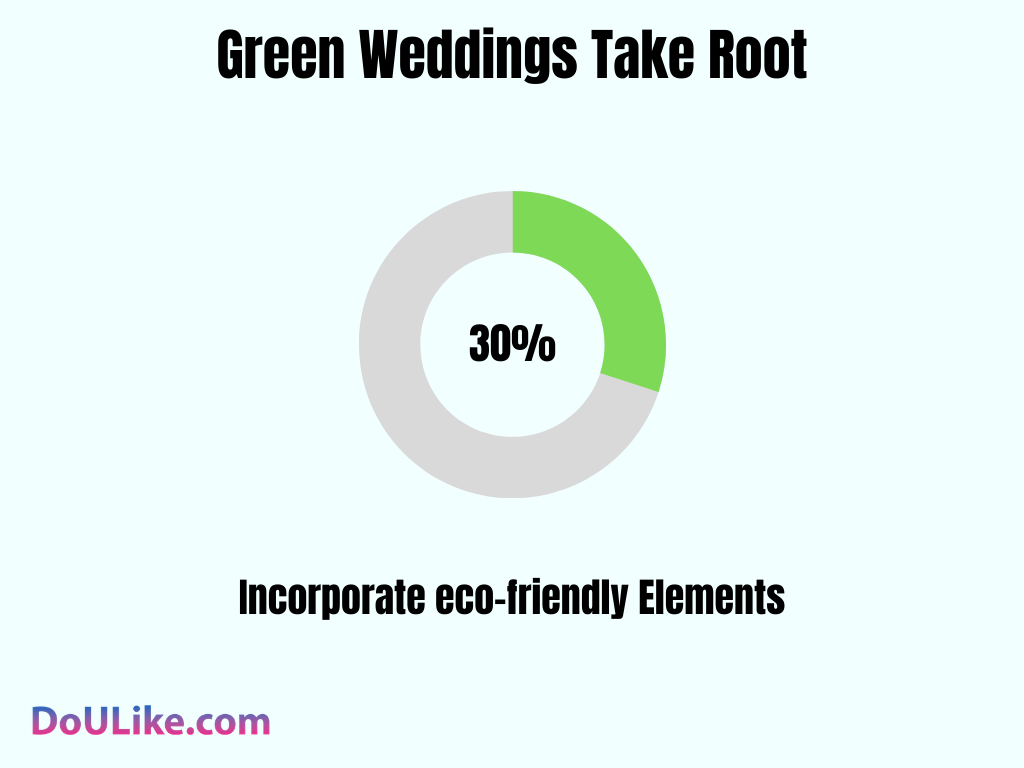
Environmental consciousness is playing a more significant role in wedding planning. A third of all couples getting married are now opting for eco-friendly options as they prepare to tie the knot. And it’s not just about recycling; many of these sustainable duos want their guests to know with everything from flowers and decorations down to invitations – plus clothing worn by the wedding party.
51% of Women Cap Their Dress Budget At $500
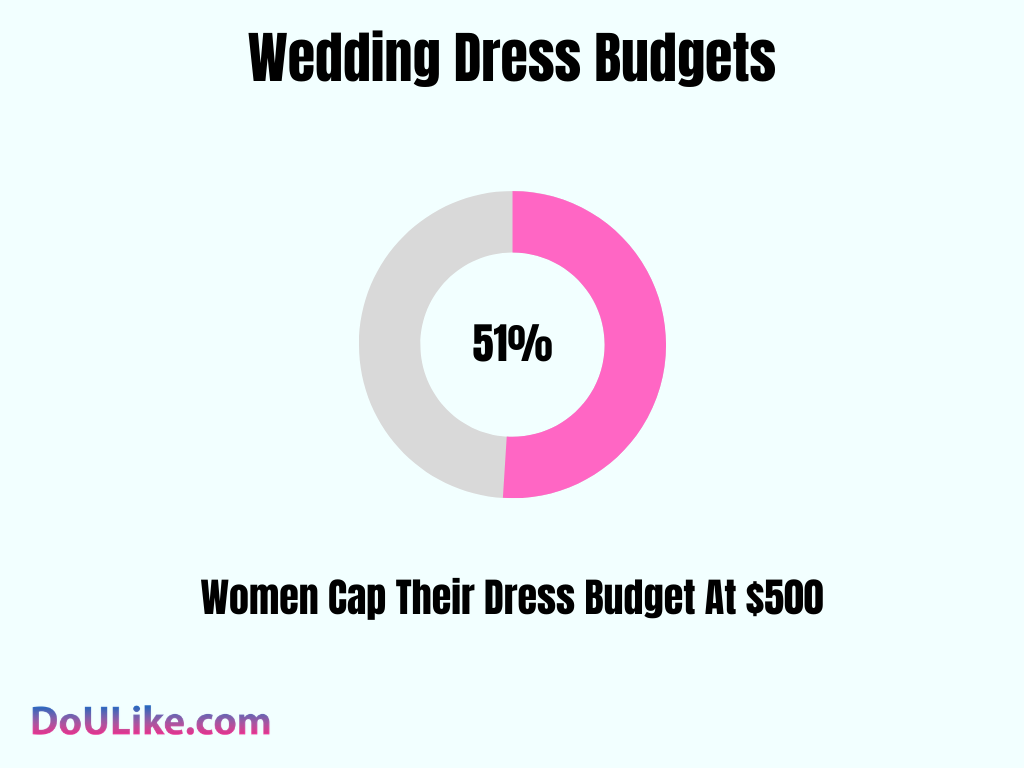
According to Civic Science, most women think cheaply about their wedding dresses. Instead of blowing big bucks like they used to, over half now say they’ll keep the tab under $500—a significant change with potentially profound implications.
49% of Grooms Choose Suits Over Tuxedos
Nearly half of grooms now opt for suits rather than tuxedos, while 27% still prefer the classic black-tie look. This shift points to a growing preference for wedding attire that blends timeless elegance with a more personalized approach to style.
Digital Trends in 2024: Rise of Virtual Weddings and Online Planning Tools
With the wedding industry’s increasing use of technology, couples are changing how they plan their big day by using online tools – and even getting married in virtual worlds:
91% of Wedding Planning Happens Online
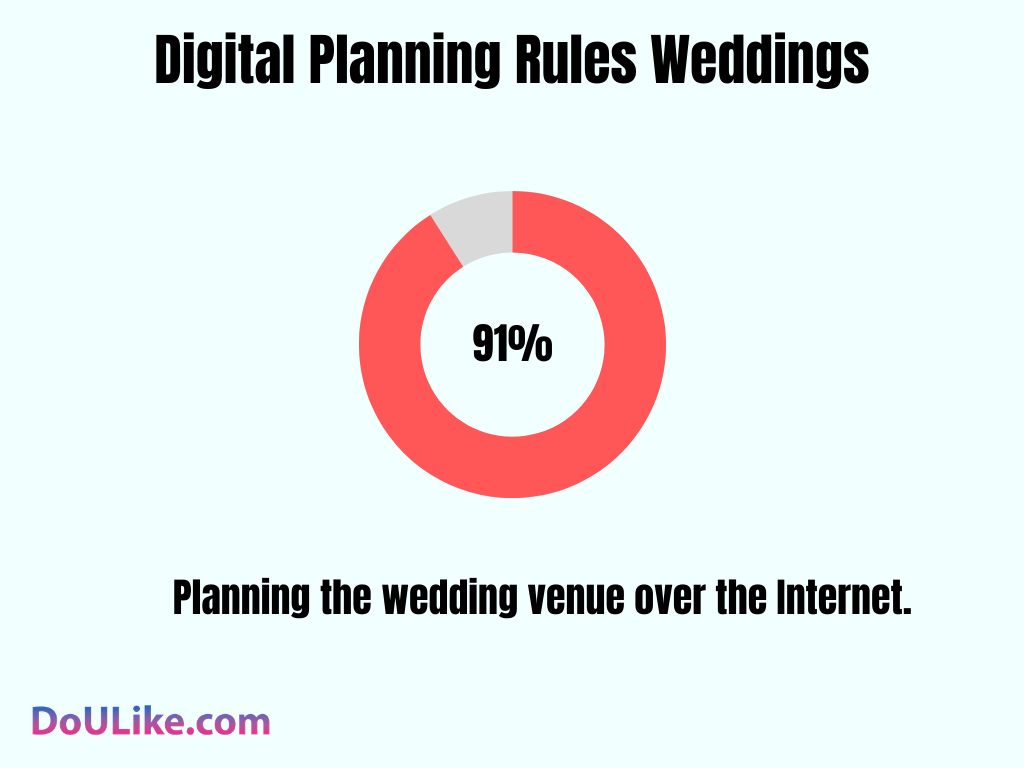
A remarkable 91% of couples’ wedding planning tasks are currently taking place over the Internet — a substantial change from more traditional methods. Websites and apps help soon-to-be newlyweds organize everything from the reception’s guest list to its location; online tools make organization easier.
30% of Couples Use Tiktok For Wedding Planning
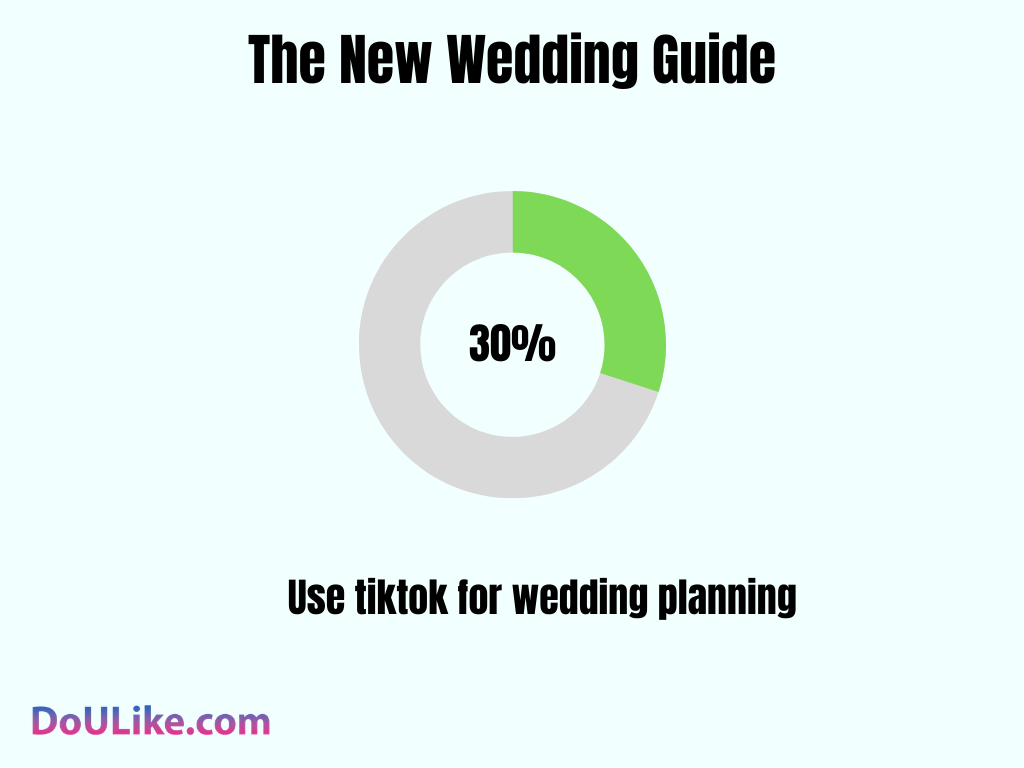
According to The Knot, 30% of couples planning their weddings are turning to TikTok for inspiration. Whether they want dance move suggestions or the latest decor trends, there is so much short-form video content available on the platform—it’s no wonder why!.
Design & Aesthetic Wedding Trends
Major wedding style trends include:
- bold color palettes
- vintage-inspired décor
- large floral installations
- multi-day wedding celebrations
Generational Wedding Differences: Gen Z vs Millennials
Gen Z represents about 41% of couples entering the wedding market.
Gen Z couples
- prefer personalization
- favor unique venues
- rely heavily on digital planning tools
Millennials
- more likely to host traditional weddings
- spend more on vendors
- invite larger guest lists
Wedding Technology Trends
Technology plays a growing role in wedding planning.
Popular digital tools include:
- wedding planning apps
- digital RSVPs
- online registries
- wedding websites
Social media platforms like Instagram and TikTok heavily influence wedding design trends.
Wedding Industry Size
The wedding industry generates over $100 billion annually in the United States.
Major sectors include:
- venues
- catering
- photography
- planning services
- floral design
- entertainment
Millions of professionals rely on weddings for income.
About This Wedding Data
This report combines data from multiple large-scale wedding industry studies, including The Knot Real Weddings Study, Zola planning surveys, Wedding Report market data, and demographic research from the CDC and Pew Research Center.
These datasets represent millions of weddings and large national surveys, making them some of the most reliable sources available for wedding statistics.
FAQ (Wedding Statistics)
How many weddings per day worldwide?Based on global demographic data, it is estimated that approximately 115,000 weddings occur every single day around the world.
How many weddings happen per year?Approximately 42 million weddings take place worldwide every year, with roughly 2.04 million of those ceremonies occurring in the United States.
How do you create a realistic wedding budget?To create a realistic budget, start by determining your total available funds from savings and contributions. Experts recommend the “50/50 Rule”: allocate 50% of your total budget to the venue, catering, and rentals, then distribute the remaining half among all other vendors, while always reserving a 10% contingency fund for unexpected costs.
What is the average cost of a wedding in the US in 2026?The average is $34,000, but the median cost (spending of “regular” couples excluding the luxury segment) is closer to $13,000-$15,000.
How long do couples plan weddings?Most couples spend 12–18 months planning.
How many guests are usually invited?The average number of guests is 117-145 people. Despite the fashion for micro-weddings, large-scale celebrations still dominate the United States.
How much does it cost to rent a venue on average?This is the largest expense item, which is around $12,200–$13,000 (about 35–40% of the total budget).
What percentage of couples does AI use for planning?About 36% of couples integrate AI tools for logistics, graphing, and idea hunting.
Are weekday weddings popular now?Yes, due to the high prices of Saturday, about 20% of couples choose Friday or Sunday, and requests for Thursday have increased by 12%.
How much money do guests give in the US?Statistically, guests give an average of $100–$160 per person, depending on the couple’s proximity and region.
What is the average age of brides in 2026?Women are 28 years old, men are 30 years old. Generation Z shifts this figure towards conscious late marriage.
How much does a wedding dress cost on average?The average price of a dress is $2,000–$2,500, with the market for used dresses growing by 25%.
What is the average duration of engagement?Couples stay in the status of brides for an average of 14-15 months.
Who pays for the wedding in 2026?Only 15% of weddings are fully paid for by the parents. Most couples (70%+) share the costs between themselves and their families.
What percentage of couples do a “First Look” (first meeting before the ceremony)?This tradition has become a standard – it is chosen by more than 55% of couples to free up time for a cocktail hour.
How many vendors does the average couple hire?In 2026, the couple works with an average of 13 different contractors.
What is the most popular wedding color?Sage Green (sage green) holds the lead (more than 50% of queries on Pinterest and Google).
What percentage of guests reject invitations (RSVPs)?The statistical marriage rate of refusals in the United States is 15-20% of the total number of invitees.
How much does a wedding photographer cost?The average check is $2900-$4500, but the demand for “documentary style” drives up the prices of the premium segment.
Do couples write their own vows?Yes, 61% of couples in 2026 are ditching standard texts in favor of personalized vows.
What percentage of couples choose sustainable weddings?About 28% of couples are actively looking for eco-friendly contractors and plastic-free décor.
What is the most popular month for a wedding in the US?October remains the leader, followed by September and June.
How much does catering cost per person?On average, couples spend $85–$115 per guest (food + alcohol).
What percentage of couples have an “Engagement Party”?About 28% of couples, with this trend growing among Gen Z who love multi-stage celebrations.
Conclusion
Wedding statistics in 2026 reveal a fascinating balance between tradition and change.
Couples today prioritize personalization, meaningful experiences, and thoughtful budgeting while still celebrating marriage as one of life’s most important milestones.
Despite rising costs and evolving trends, weddings remain one of the most significant social traditions worldwide.
Sources
Centers for Disease Control and Prevention. (2024). Marriage and Divorce Statistics: United States Vital Statistics Reports. National Center for Health Statistics.
Pew Research Center. (2024). Marriage and Cohabitation in the United States. Washington, DC: Pew Research Center.
The Knot Worldwide. (2026). The Knot Real Weddings Study: Wedding Data Insights and Industry Report. New York, NY: The Knot Worldwide.
Zola Inc. (2026). The First Look Report 2026: Wedding Planning Trends and Cost Insights. New York, NY: Zola Inc.
Wedding Report Inc. (2025). The U.S. Wedding Market Report. Orlando, FL: Wedding Report.
Kande Photobooths. (2026). Wedding Statistics and Industry Trends Report. United States.
NerdWallet. (2026). Average Wedding Cost Analysis in the United States. San Francisco, CA.
United Nations Department of Economic and Social Affairs. (2024). Global Marriage and Family Demographic Trends. New York, NY: United Nations.
Centers for Disease Control and Prevention. (2024). Marriage and Divorce Statistics: United States Vital Statistics Reports. Atlanta, GA: National Center for Health Statistics.
Pew Research Center. (2024). Marriage and Cohabitation in the United States. Washington, DC: Pew Research Center.
The Knot Worldwide. (2026). The Knot Real Weddings Study: Wedding Data Insights and Industry Report. New York, NY: The Knot Worldwide.
Zola Inc. (2025). The First Look Report: Wedding Planning Trends and Cost Insights. New York, NY: Zola Inc.
Wedding Report Inc. (2025). The U.S. Wedding Market Report. Orlando, FL: Wedding Report Inc.
NerdWallet. (2026). Average Wedding Cost Analysis in the United States. San Francisco, CA: NerdWallet.
United Nations Department of Economic and Social Affairs. (2024). Global Marriage and Family Demographic Trends. New York, NY: United Nations.
The Knot Research & Insights Team. (2026). The Knot Real Weddings Study: Data Read-Out. New York, NY: The Knot Worldwide.
Our Editorial Team at DoULike understands the challenges of today’s dating scene. That’s why we offer guidance on everything from online profiles to in-person chemistry. With our tips, you’ll feel ready to take the next step in finding love.