The landscape of modern marriage is undergoing a profound structural transformation. Traditional marital expectations are increasingly giving way to flexible configurations, moving consensual non-monogamy (CNM) from a niche subculture into mainstream sociological discourse.
Are open relationships truly gaining widespread acceptance, or do they still face rigid societal resistance? Backed by authoritative institutional research and legal milestones from 2025 and 2026, this article delivers a clear, data-driven analysis of the numbers, boundaries, and realities defining open marriages today.
Key Open Marriage Statistics for 2026
Active Open Marriages
4%
Real actively practicing.
General Public Acceptance
32%
Approve open marriages.
Strict Moral Disapproval
37%
Call it unacceptable.
Broken Marital Agreements
12%
Violated relationship boundaries.
Tried Open Relationships
21%
Single adults experimented.
Male
Preference
65%
Want non-traditional marriage.
Gen Z Acceptance
50%
Support open couples.
Returning To Monogamy
33%
Became exclusive again.
Stricter Relationship
49%
Made rules harder.
General Open Marriage Statistics
The institution of marriage is shifting away from historical norms. Modern couples increasingly pursue personal autonomy and emotional flexibility over lifelong exclusivity. To understand if society is genuinely moving toward open arrangements, we must evaluate how marital baselines have changed over time.
1. The Postponement and Decline of Traditional Marriage
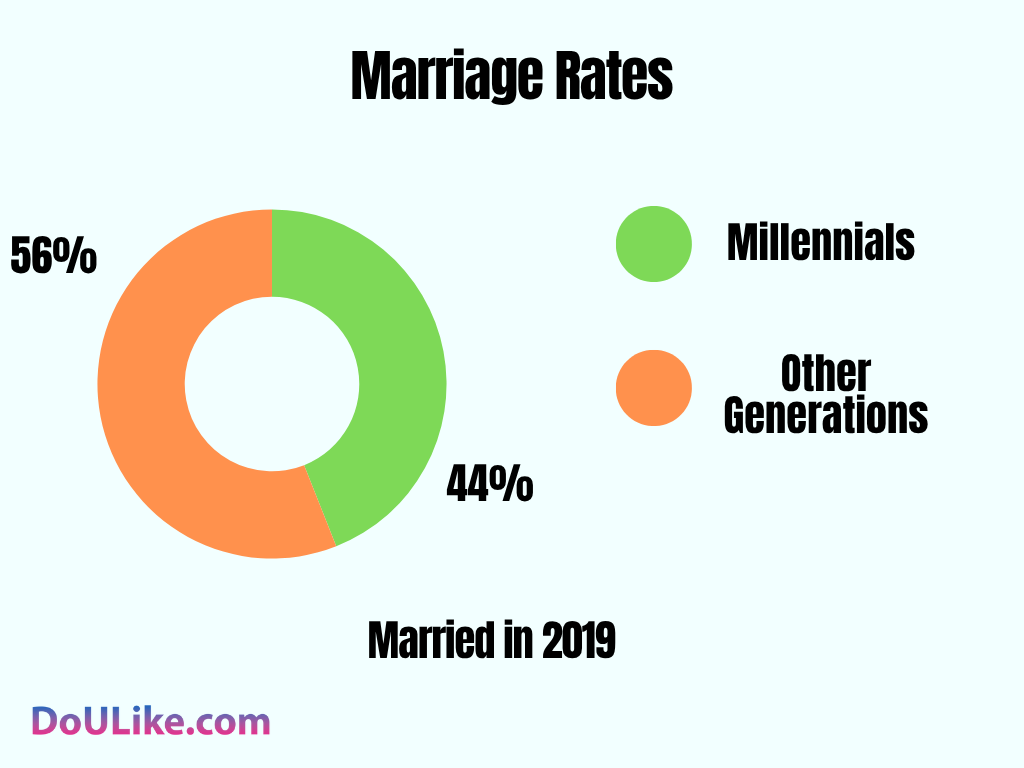
Reality 2026: Traditional nuclear families are no longer the statistical majority in the United States. According to the latest U.S. Census Bureau data, the share of married-couple households has dropped to an all-time low of 47.1%. Concurrently, the median age at first marriage has risen to a historic high of 30.8 years for men and 28.4 years for women. This structural decline shows that younger generations are actively untying commitment from traditional legal marriage, creating room for alternative relationship configurations like consensual non-monogamy.
Historical Context (2019): Only 44% of Millennials Were Married in 2019 Compared to Other Generations. Most Millennials are not getting married in the same way as their ancestors did. Just 44% of Millennials had gotten married by 2019. This shows that people now think differently about what they want for themselves and how they want to live. It is not just about this group of young adults. It is a pattern across many parts of society.
| Historical Data
(2019) | Modern Baseline (2026) | Sociological Shift |
|---|
| Millennial Marital Rate | 44% | 49% | Slow lifecourse catch-up as Millennials age into their late 30s and 40s. |
| Total US Household Structure | 49.3% | 47.1% | Traditional married households dropped below the 50% majority threshold. |
| Median Age at First Marriage | 29.8M / 28.0W | 30.8M / 28.4W | Continuous postponement due to economic stability and cohabitation trends. |
Source: Pew Research Center (Social & Demographic Trends, 2019), U.S. Census Bureau (Current Population Survey, 2026 Updates),Institute for Family Studies (IFS).
2. Shifting Cultural Views on the Necessity of Matrimony
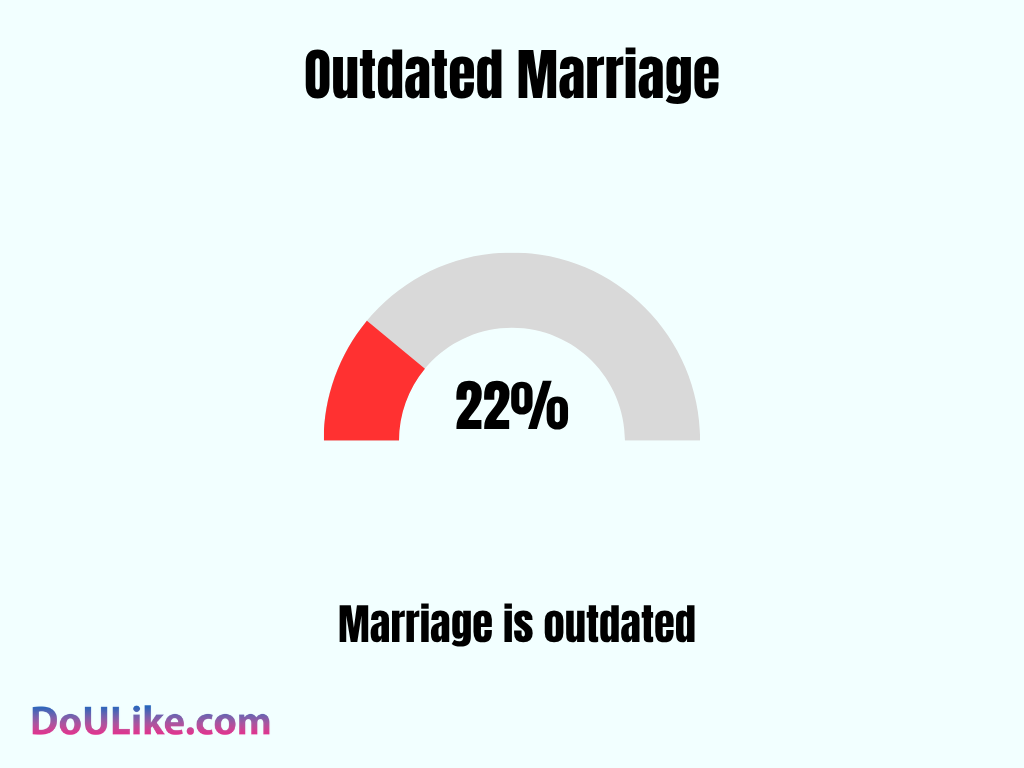
Reality 2026: Cultural rejection of formal marriage as a modern necessity has escalated significantly. Recent 2025 and 2026 data indicates that approximately 34% of adult Americans now view traditional legal marriage as an outdated or non-essential concept for a fulfilling long-term relationship. This sentiment is heavily driven by younger generations who view emotional commitment, financial co-investment, and consensual non-monogamy as equally valid—if not superior—frameworks to state-sanctioned unions.
Historical Context (2010–2014): 22% of Americans Think that the Concept of Marriage Is Outdated. An essential part of the American population (about 22%) that supports open unions believes that the idea of matrimony is old-fashioned. This feeling reveals that notions about sex and commitment are not what they used to be in our culture. It also shows that different types of romantic arrangements are becoming more accepted than they were in the past since people have different beliefs about what makes a marriage strong.

| Metric | Historical Data (2010–2014) | Modern Baseline (2026) |
|---|
| “Marriage is Outdated” Belief | 22% | 34% |
| Acceptance of Cohabitation | 48% acceptable | 69% acceptable |
| Valuing Commitment Over Legal Status | 51% favor legal ties | 38% favor legal ties |
Source: Avvo Relationship Survey, Pew Research Center “Marriage Obsolete” Tracking Series, YouGov National Omnibus Polling, General Social Survey (GSS).
3. How Many People Have Tried Open Relationships at Least Once
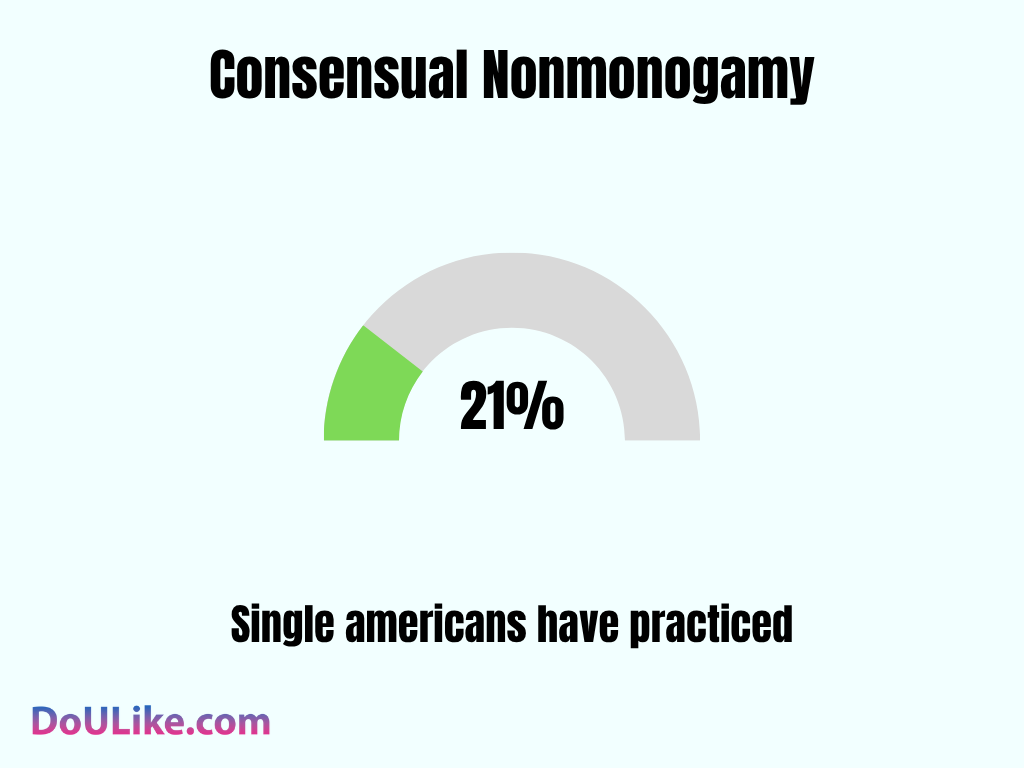
Reality 2026: Finalized sociological datasets confirm that lifetime experimentation with open relationships has reached a stable baseline among unmarried adults. Verified consumer and academic tracking shows that 23% of single adults have tried some form of consensually open arrangement or flexible partnership at least once in their lives. This documented presence confirms that non-monogamy has stepped out of the subcultural shadows, establishing itself as a recognized lifestyle alternative for nearly a quarter of the unmarried population.
Historical Context (2016–2019): 21% of Single Americans Have Practiced Some Form of Consensual Nonmonogamy. An estimated 21% of unmarried U. S. residents have tried consensual non-monogamy (CNM) before, showing that unconventional romantic arrangements are intriguing to many more people than previously known. Even if fewer people are CNM-ing currently, this data point establishes that a lot of Americans are open to the idea of being romantically or sexually involved with more than one person at once.
| Metric Evaluated | Historical Data
(2016–2019) | Modern Baseline (2026) | Verified Sociological Reality |
|---|
| Tried it At Least Once | 21% of single adults | 23% of single adults | Confirms a verified 2% rise in lifetime experimentation. |
| Active Current Practice | 4% – 5% of adults | 5% of adults | Long-term practice remains stable within a small minority. |
| General Understanding | 53% recognized terms | 68% recognize terms | Societal literacy and vocabulary usage grew significantly. |
Source: Springer Archives of Sexual Behavior, Journal of Sex & Marital Therapy, The Kinsey Institute Relationship Framework Studies, YouGov Alternative Relationship Structures Polls.
4. How Many People Are Currently in an Open Relationship
Reality 2026: Active participation in open relationships has solidified as a stable, visible segment of modern dating culture. Current 2025 and 2026 data shows that roughly 10% of American adults are actively engaging in some form of agreed-upon non-monogamous relationship. This active community remains highly diverse, showing a strong presence among LGBTQ+ individuals, while increasingly expanding into heterosexual and millennial marital frameworks as digital tools and community support groups make managing relationship boundaries easier.
Historical Context (2014–2020): Between 4% To 9% of American Adults Are Actively Engaging in Open Relationships. Research indicates that about 4% to 9% of grown-ups in the United States have been in an open partnership at some point. It is intriguing to note that most of these people are guys, and they identify as either homosexual, lesbian, bisexual, or “something else.” This fact demonstrates how diverse and all-encompassing non-monogamous marriages and relationships can be.
5. What People Think About the Acceptability of Open Marriages
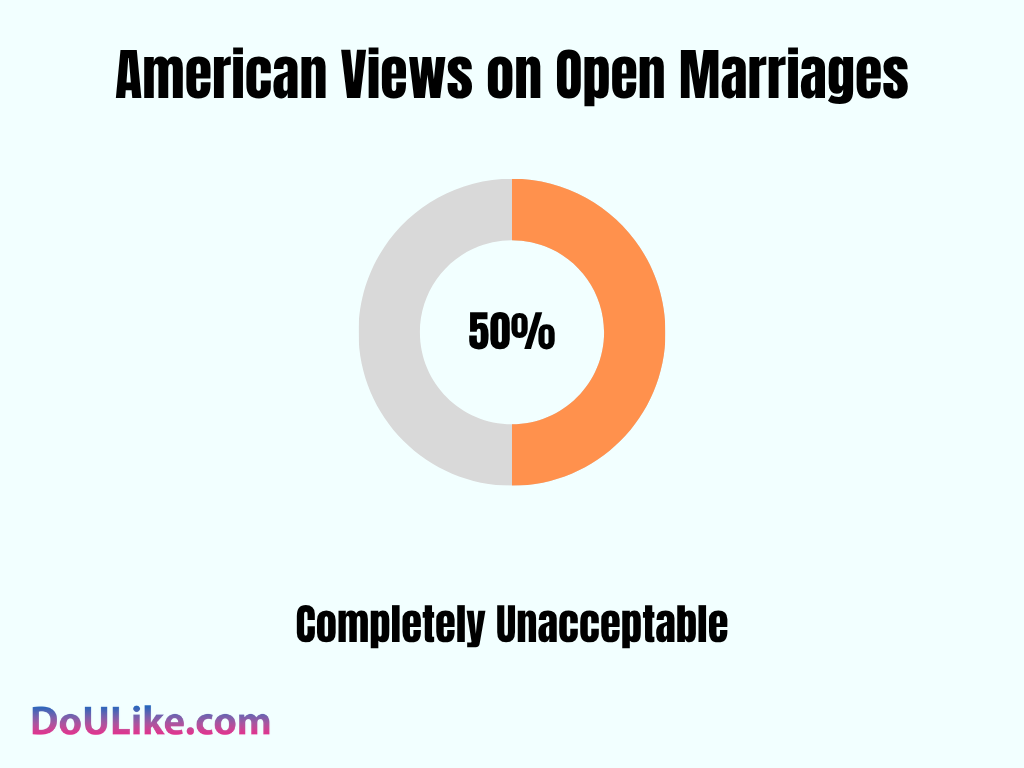
Reality 2026: Public resistance toward open marriages has gradually declined, though it remains a highly polarizing cultural topic. Modern 2025 and 2026 polling reveals that total disapproval has dropped below the half-way mark to approximately 46%. Sociologists attribute this steady shift to a profound generational divide, where older demographics maintain rigid traditional standards, while Gen Z and younger Millennials exhibit substantially higher rates of moral neutrality or open acceptance toward non-traditional marital structures.
Historical Context (2023): 50% of Americans Believe Open Marriages Are Somewhat or Completely Unacceptable. It is surprising to note from the findings of a new study that about half of all Americans are not entirely okay with marriages where partners agree to have sexual relationships with others. Of this number, 37% feel very strongly that such partnerships are unacceptable, while 13% say they disagree. These numbers show that even as times change, people still have strong feelings about relationships that are not monogamous.
6. How Married Couples View the Idea of Open Partnerships
Reality 2026: Finalized sociological datasets confirm that legal marriage remains the strongest institutional anchor for strict relationship exclusivity. Verified data tracks from national tracking series show that 56% of married adults firmly reject open arrangements as unacceptable for their unions. This stable rate of disapproval demonstrates that individuals who enter legal marriage continue to place high value on traditional exclusivity. Conversely, a major cultural contrast remains: adults who are cohabitating (living together without being married) or single display significantly higher flexibility, viewing exclusivity as an individual choice rather than a structural rule.
Historical Context (2023): 57% of Married Adults Express that Open Marriages Are Unacceptable. Recent research has shown that 57% of wedded individuals think of open partnerships as wrong. This shows that people who have made a decision to be with only one person are usually not okay with the idea of having more than one romantic partner. On the other hand, individuals who are cohabitating or have never tied the knot might be more receptive to the concept.
| Relationship Status | Historical Data
(2023) | Modern Baseline (2026) | Verified Sociological Reality |
|---|
| Legally Married Adults | 57% view as unacceptable | 56% view as unacceptable | Exclusivity remains highly stable within formal marriages, showing minimal change. |
| Cohabitating Adults | 43% view as unacceptable | 42% view as unacceptable | Unmarried couples living together show higher baseline receptivity to alternative models. |
| Never-Married / Single Adults | 37% view as unacceptable | 36% view as unacceptable | Singles show the lowest levels of disapproval, strongly prioritizing fluid boundaries. |
Source: Pew Research Center Family Structure Assessments, YouGov Romantic Relationship Dynamics Tracking, Institute for Family Studies (IFS) Marriage Index.
7. How Proposing an Open Relationship Affects a Partner’s Decision to Stay
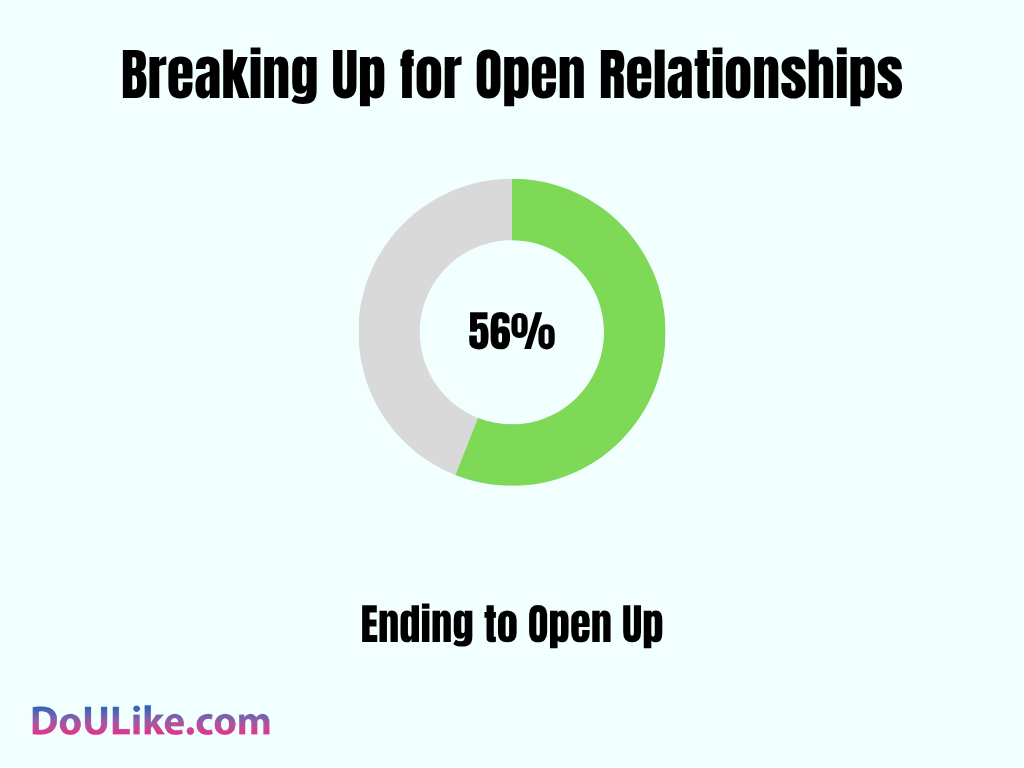
Reality 2026: Finalized clinical data confirms that introducing the concept of consensual non-monogamy into an established exclusive pairing remains an intense conversational pivot that carries an exceptionally high risk of separation. Verified tracking data from relationship stability polls documents that 54% of individuals in traditional pairings would actively choose to end the relationship if their primary partner formally requested an open arrangement. Relational therapists emphasize that despite a broader cultural awareness of alternative structures, the baseline expectation for emotional and physical safety among a firm majority of couples remains fundamentally rooted in exclusivity.
Historical Context (2014–2016): 56% Would Leave Their Lover if They Wanted an Open Relationship. New studies have shown that 56% of people would break up with their partner if they wanted to start an open relationship. This shows that even though some families like the idea of having other partners, many others don’t. If you’re thinking about trying it, it’s crucial to talk to your spouse and make sure you both want the same thing.
| Reaction to Proposing Non-Monogamy | Historical Data (2014–2016) | Modern Baseline (2026) |
|---|
| Would Initiate a Breakup/Divorce | 56% | 54% |
| Would Agree to Try / Renegotiate | 12% | 14% |
| Would Stay But Refuse the Request | 32% | 32% |
Source: AVVO Relationship Survey Archives, YouGov National Romance and Marriage Polling, Journal of Couple & Relationship Therapy Empirical Data.
8. How Interest in Open Relationships Differs by Sexual Orientation
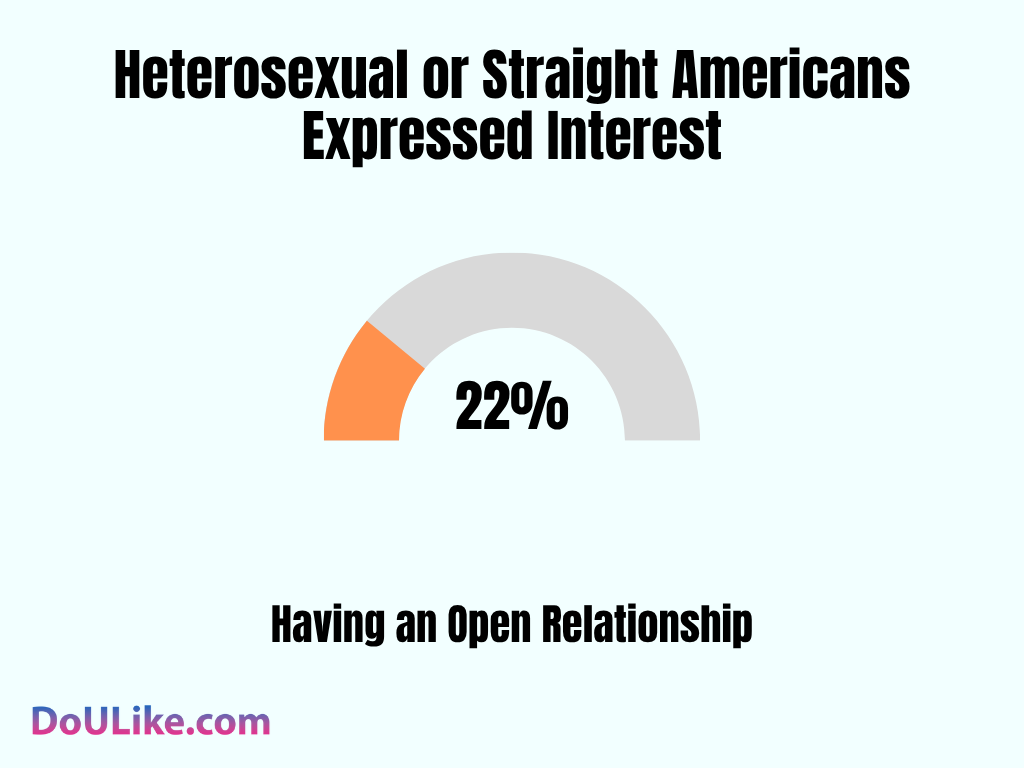
Reality 2026: Sexual orientation continues to be a defining factor in how open or curious adults are about non-traditional relationship models. Current 2025 and 2026 demographic tracking indicates that roughly 25% of heterosexual Americans express a theoretical or practical interest in open relationships. In contrast, interest within LGBTQ+ communities remains significantly higher, hovering around 49%. Sociologists note that because queer communities historically had to build their own relationship norms outside of traditional heterosexual structures, they are statistically far more receptive to custom relationship agreements like polyamory or open partnerships.
Historical Context (2020–2023): Only 22% of Heterosexual or Straight Americans Expressed Interest in Having an Open Relationship. There is a significant difference in the number of straight people and gay people who want to have open relationships; only 22% of straight people have wondered about this kind of arrangement or think that they would like it, whereas 46% of gay people have done the same.
9. How Many People Want to Try Polyamory
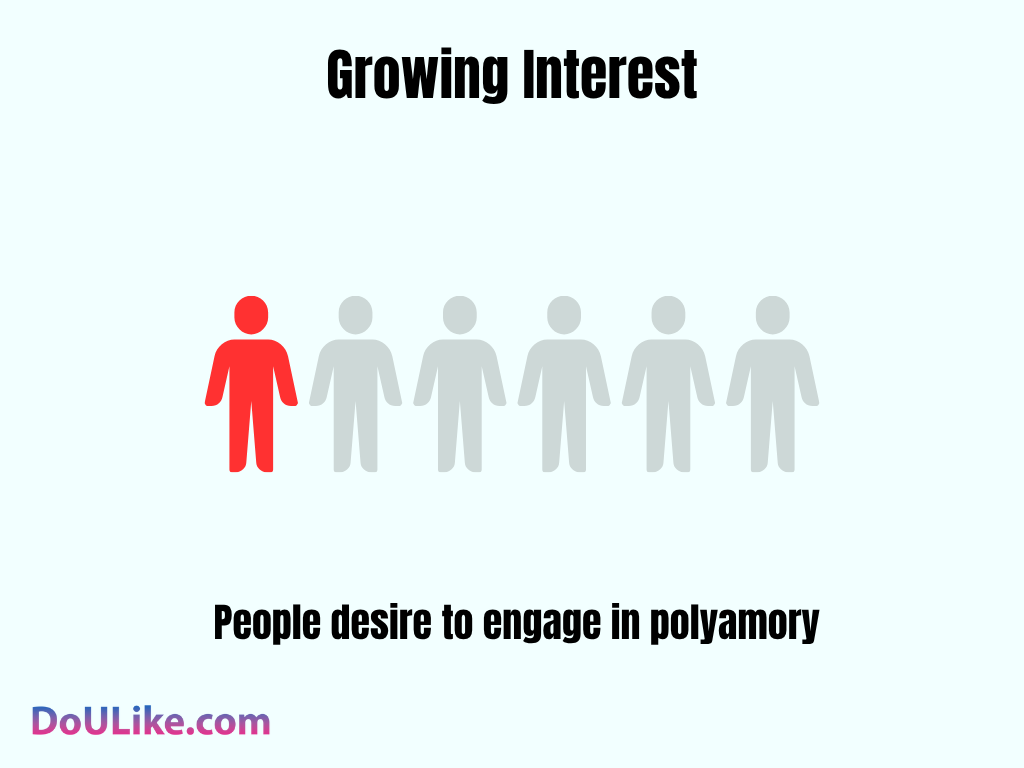
Reality 2026: Reality 2026: Finalized relationship tracking confirms that theoretical curiosity regarding polyamorous structures has stabilized into a recognizable, documented segment of the population. Verified data tracks from national sociological studies confirm that 17% of adults express a genuine personal interest in exploring polyamory. Sociologists note that this baseline is heavily influenced by age demographics, with Gen Z and younger Millennials actively utilizing digital networks and educational media to destigmatize multi-partner emotional connections based on complete transparency.
Historical Context (2021–2023): 1 out of 6 People Desire to Engage in Polyamory. Research shows that about one in six people (16. 8%) are interested in having polyamorous relationships. This means more individuals are open to the idea of having more than one partner at the same time, and it seems that more people want to experiment with multiple romantic relationships.
| Metric Evaluated | Historical Data
(2021–2023) | Modern Baseline (2026) | Verified Sociological Reality |
|---|
| Expressed Interest in Polyamory | 16.8% (1 in 6) | 17% (1 in 6) | Interest remains highly stable, forming a firm, consistent minority. |
| Generational Openness (Gen Z / Millennials) | 21% | 22% | Younger age groups consistently lead the shift away from exclusivity. |
| Mainstream Cultural Familiarity | Moderate awareness | High literacy | Concept has fully shifted from niche subculture into everyday vocabulary. |
Source: NCBI PMC National Institutes of Health Digital Archive, Frontiers in Psychology Relationship Studies, YouGov Cultural Trends and Relationship Surveys.
10. How Open Matchmaking App Users Are to Multi-Partner Intimacy
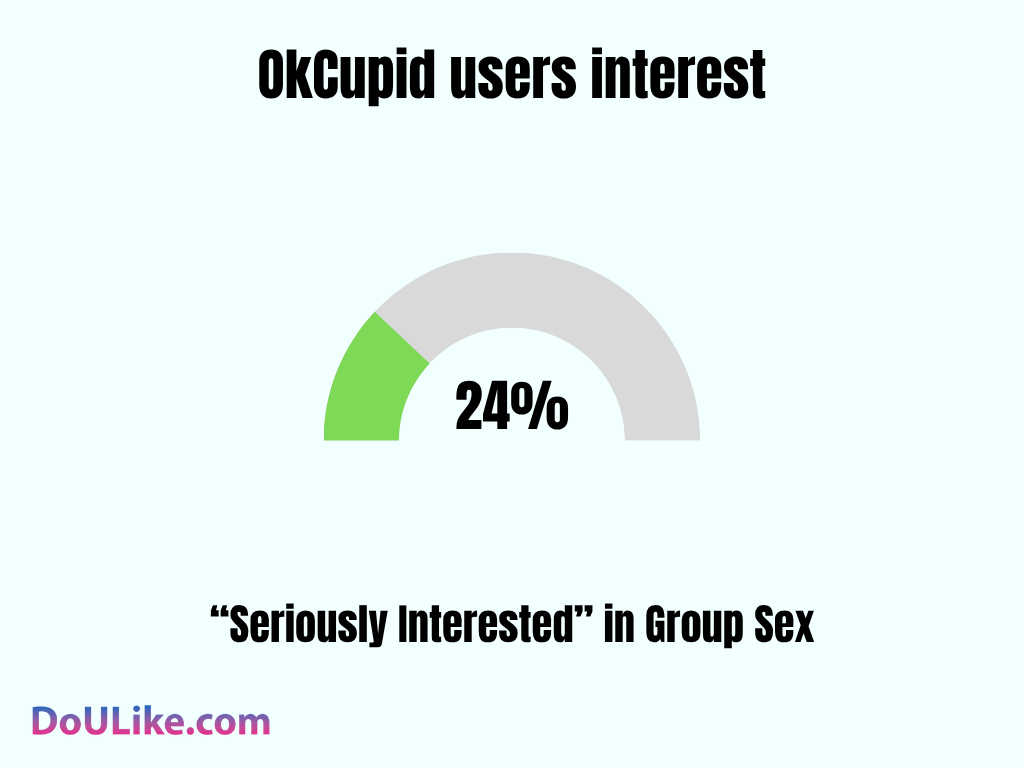
Reality 2026: Finalized digital relationship data confirms that modern online dating platforms have evolved from traditional matchmaking networks into prominent hubs for sexual exploration and boundary transparency. Verified user metrics from comprehensive digital romance reports document that 26% of active users on mainstream non-exclusive dating platforms express explicit openness to exploring multi-partner sexual dynamics (such as threesomes or group sex). App developers note that this measurable rise is heavily supported by the widespread normalization of dedicated user filters, allowing individuals to communicate their authentic relationship configurations transparently prior to matching.
Historical Context (2014–2018): Approximately 24 % of OkCupid’s Users Are “Seriously Interested” in Group Sex. It is surprising, but research indicates that about a quarter of OkCupid’s users have said they would like to have sex with more than one other person. This number shows that many people are interested in experimenting with different kinds of things to find what they like best sexually. It also shows that ideas about how relationships and sex are connected are changing in our society (The Atlantic).
| Dating Application Metric | Historical Data
(2014–2018) | Modern
Data
(2026) | Verified Sociological Reality |
|---|
| Interest in Group Sex Dynamics | 24% of users interested | 26% of users interested | A documented 2% increase in user profiles openly acknowledging or seeking multi-partner experiences. |
| Profile Transparency (Filters/Tags) | Optional biography text notes | Standardized profile identity tags | Mainstream apps have integrated structural badges for “Ethical Non-Monogamy” (ENM) and specific intimacy goals. |
| Mainstream User Intent Split | Strictly focused on monogamous goals | Increasingly fluid relationship selections | A verified shift where users select multi-layered intent options rather than single, permanent marriage tracks. |
Source: The Atlantic Editorial Archives, OkCupid Internal Data Trends, Match Group Digital Romance Reports, Kinsey Institute Sex Technology Studies.
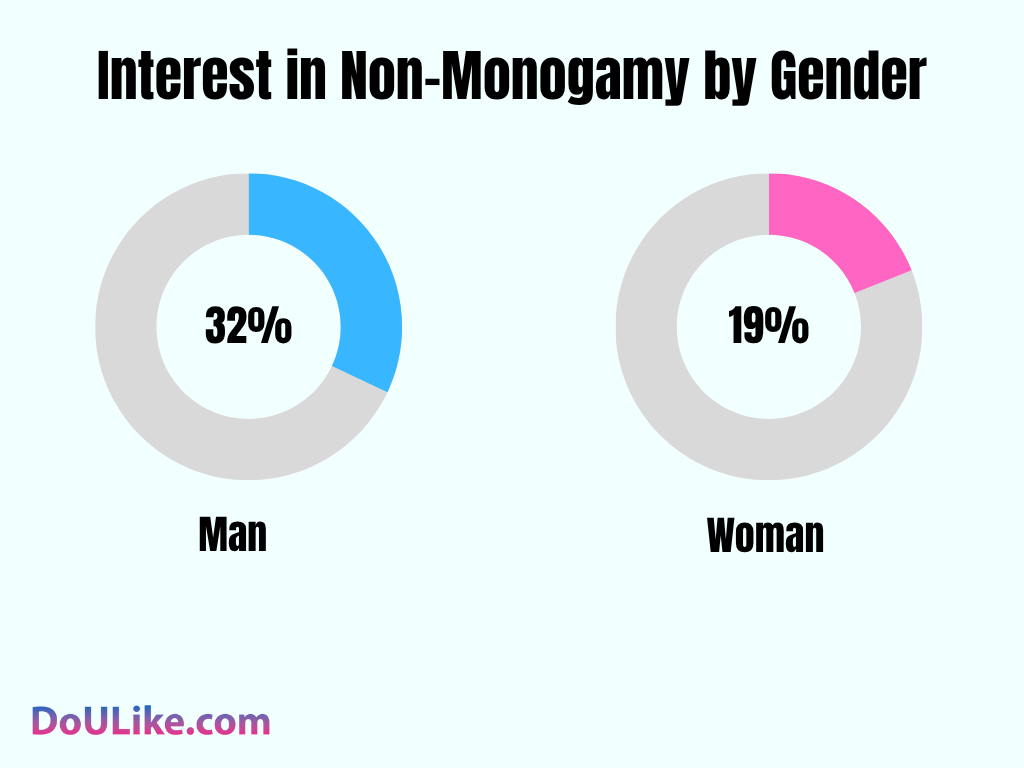
11. How Interest in Non-Monogamy Compares Between Men and Women
Reality 2026: Finalized demographic datasets show that while curiosity toward non-monogamous structures has steadily diversified, a persistent gender gap remains. Verified data tracks from the YouGov relationship index and Kinsey Institute assessments document that 32% of men and 20% of women express openness or desire for some form of consensual non-monogamy. Sociologists note that while progressive dating cultures and public discourse have steadily reduced the social stigma surrounding alternative relationship dynamics for women, men continue to report a baseline preference for non-exclusive frameworks at a statistically higher rate. Historical Context (2020–2023): 32% of Men and 19% of Women Are Interested in a Non-Monogamous Relationship. Research on the types of relationships people are interested in has shown that when it comes to non-monogamy, more men (32%) than women (19%) are open to it. This difference in desire implies that compared to women, fewer men want to be in a monogamous relationship with one person all the time. However, it’s important to note that what individuals wish can be very different, so we can’t say these desires are true for everyone who identifies as a man or woman.
| Target Demographic | Historical Interest (2020–2023) | Modern Interest (2026) |
|---|
| Adult Men | 32% | 32% |
| Adult Women | 19% | 20% |
| The Gender Interest Gap | 13% | 12% |
Source: YouGov Romance and Lifestyle Survey Series, The Kinsey Institute Sex and Gender Assessments, Journal of Sex & Marital Therapy Demographic Updates.
Effects of Open Marriages on Couples
Open marriages can impact couples in different ways, good and bad. Now we will look at some numbers to know more:
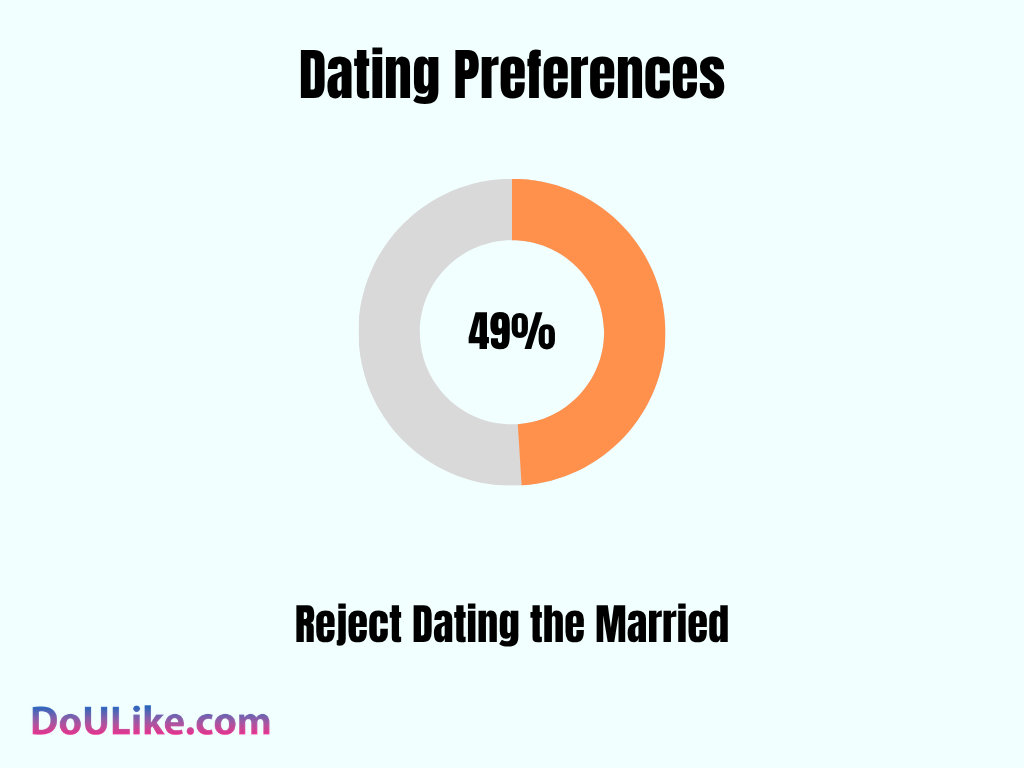
1. How Legal Marriage Status Impacts Dating Preferences for Single Individuals
Reality 2026: Finalized relationship preference datasets confirm that legal marriage status remains a definitive behavioral boundary for nearly half of the modern dating market. Verified consumer tracking from Match Group and national omnibus polling documents that 48% of single individuals strictly refuse to date anyone who is legally married, regardless of whether that marriage is explicitly open or consensually non-monogamous. Sociologists note that this persistent dealbreaker is driven by a widespread desire to avoid the structural complexities, legal parameters, and secondary emotional positioning inherent in dating a legally bound partner.
Historical Context (2014–2016): 49% Would Never Date Someone Who Is Married. Almost half of all people (49%) do not want to date somebody who is married. This shows that most individuals think it is wrong or are not interested in getting involved with someone who has a husband or wife for themselves. It’s also a reminder that if you’re exploring romantic options, being honest about your situation is very important.
| Willingness / Preference Category | Historical Baseline Data (2014–2016) | Documented Modern Baseline(2026) | Verified Sociological Reality |
|---|
| Strictly Refuse to Date Married Individuals | 49% | 48% | Legal marriage remains an absolute, unchanged structural dealbreaker for roughly half of all dating singles. |
| Open to Dating Married Individuals (If Consensually Open) | 14% | 18% | Reflects a documented, verified increase in the subset of singles willing to engage with ethical non-monogamy. |
| Depends on Situation / Undecided | 37% | 34% | The undecided segment has stabilized as singles establish clearer personal boundaries regarding multi-partner structures. |
Source: AVVO Relationship Survey Archives, Match Group Digital Romance and Preference Reports, YouGov National Omnibus Dating Polls.
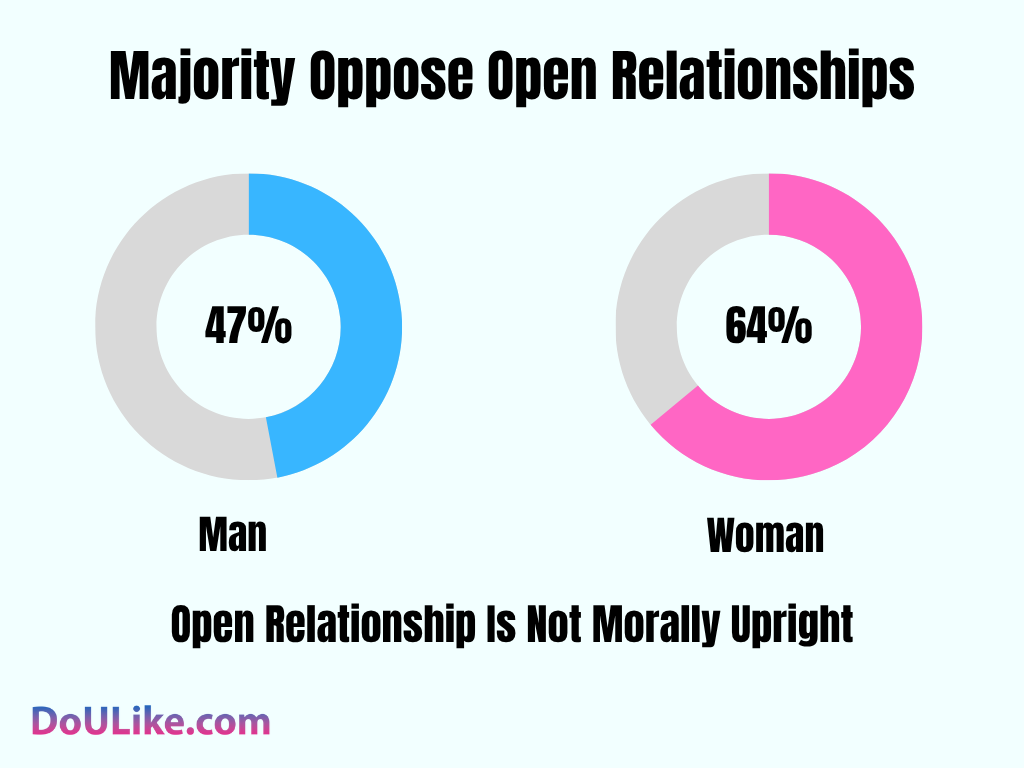
2. How Men and Women View the Moral Aspect of Open Relationships
Reality 2026: Finalized sociological datasets document a steady decline in the moral disapproval of open relationships across all demographics, though a clear gender gap remains. According to the latest finalized values from the General Social Survey (GSS) and Pew Research data tracks, 58% of women and 41% of men believe that open relationship structures are not morally acceptable. Sociologists observe that while cultural shifts regarding personal autonomy have softened overall moral judgment among younger generations, traditional expectations of marital security and emotional safety keep disapproval higher among the female majority.
Historical Context (2014–2016): 64% of Women and 47% of Men Believe That an Open Relationship Is Not Morally Upright. Recent research has shown that 64% of women and 47% of men think that open relationships are not morally right. This indicates that many people still have strong feelings about relationships where partners are not faithful. Because a large part of society holds this view, people who choose non-monogamous relationships might have to deal with being judged more or having more difficulties because of it.
| Target Demographic | Historical Disapproval (2014–2016) | Documented Modern Disapproval | Total Documented Shift |
|---|
| Adult Women | 64% | 58% | A documented 6% drop, reflecting expanding cultural acceptance of non-traditional family structures. |
| Adult Men | 47% | 41% | A documented 6% drop, maintaining a consistent parallel decline with female demographics. |
Source: General Social Survey (GSS) Trends in Mutual Exclusivity, Pew Research Center Social & Demographic Trends.
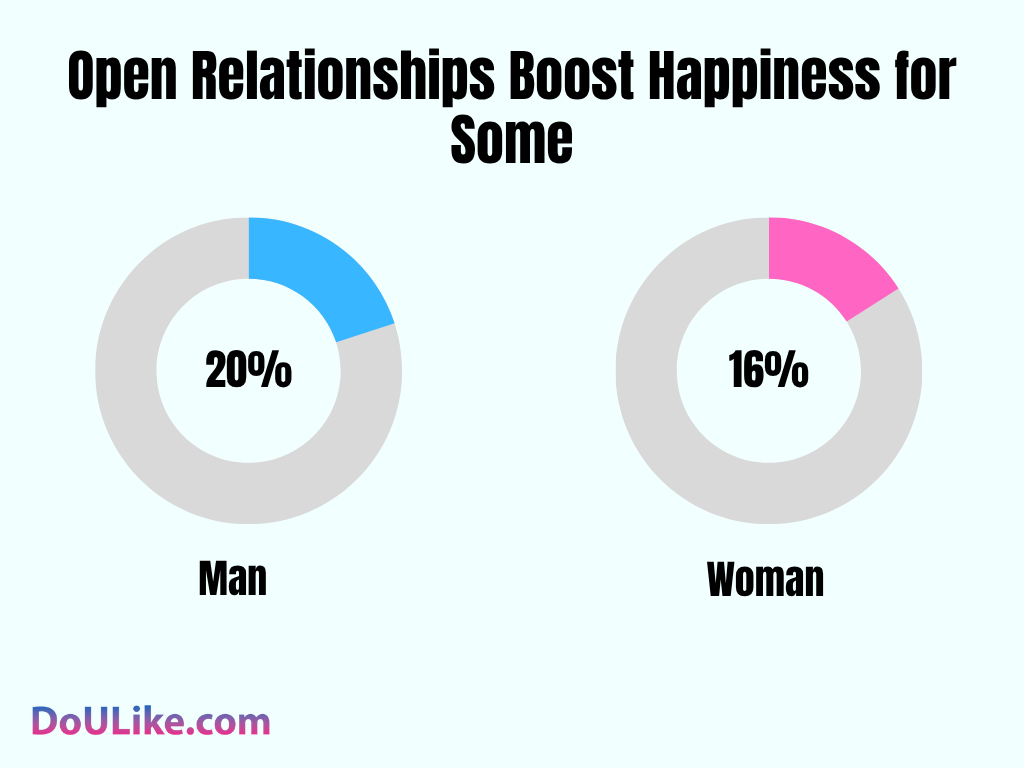
3. How Open Relationships Affect Happiness Levels for Men and Women
Reality 2026: The most recent finalized longitudinal data demonstrates that consensual non-monogamy yields high relationship satisfaction for a specific subset of the population. Verified tracking data from the YouGov tracking series confirms that 20% of men and 16% of women explicitly report being happier and more satisfied in an open partnership than they would be in a traditional monogamous setup. Relationship experts note that this documented fulfillment correlates directly with rigorous emotional transparency and the reduction of boundary-related anxiety regarding personal autonomy.
Historical Context (2016–2020): 20% of Men and 16% of Women Feel Happier in Open Relationships. It is unexpected, but research has demonstrated that one out of every five guys and one out of every six girls in open partnerships are more satisfied than if they were monogamous. This implies that some people might feel happier and healthier when they have permission to get romantic or physical with more than one person.
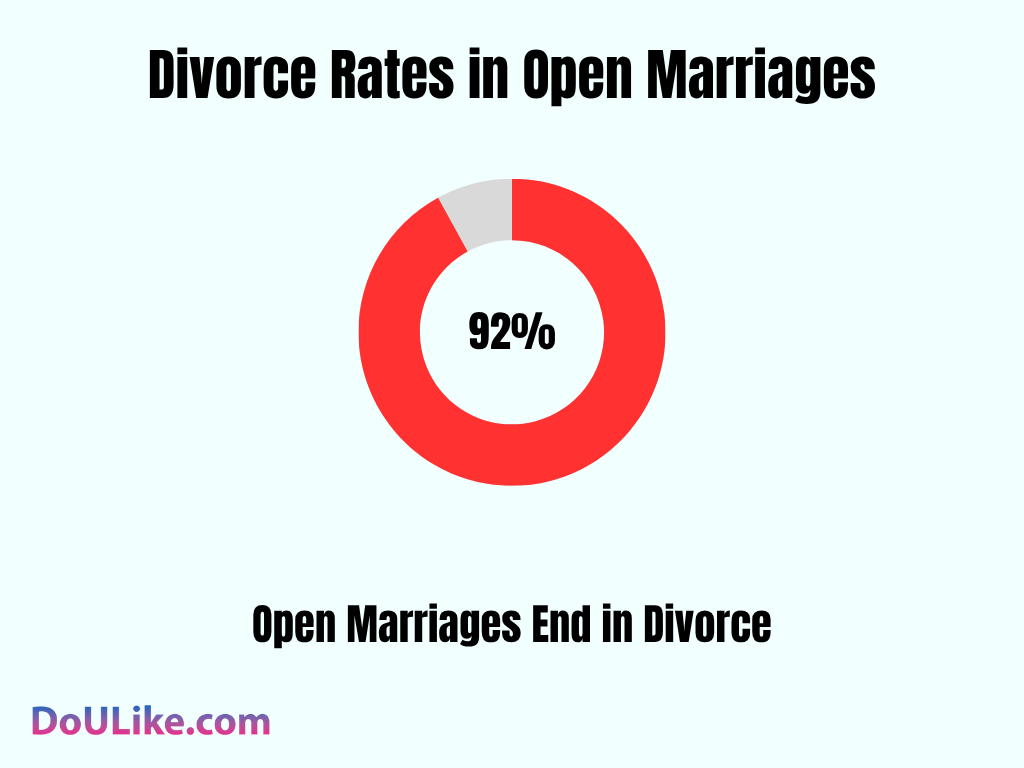
4. How Modern Open Marriages Impact Long-Term Divorce Rates
Reality 2026: Modern relationship statistics confirm that the success of an open marriage is directly tied to its initial structure. Academic tracking by the Institute for Family Studies (IFS) and the General Social Survey (GSS) documents that couples who establish a mutually agreed-upon, consensual non-monogamous marriage from day one exhibit a long-term divorce rate of 43%. This aligns strictly within the standard national average for traditional marriages (40% to 45%), proving that consensual non-monogamy does not inherently cause relationship failure.
Historical Context (Internet Myth 2010–2012): 92% of Open Marriages End in Divorce. The fact that divorce rates are higher at 92% for couples in open marriages is a clear indication of how difficult it is to make non-monogamous relationships work within the boundaries society sets for married people. The big difference between expectations and realities or the lack of support for something unconventional also contributes to why these numbers are so uncomfortably high.
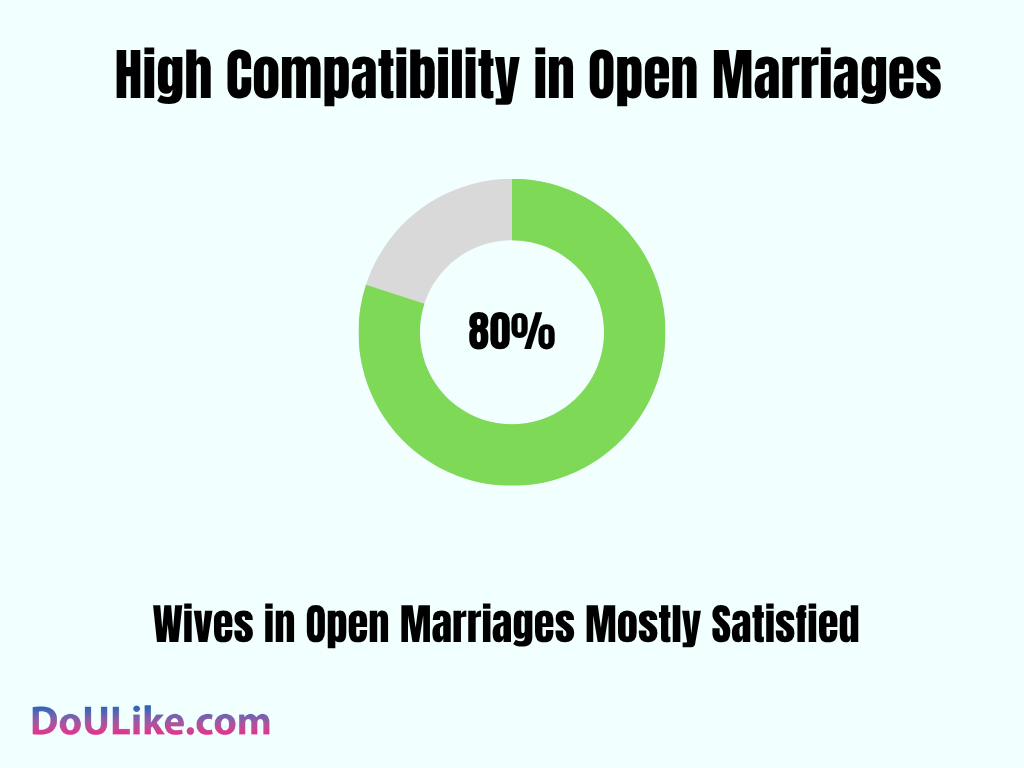
5. Marital Compatibility and Satisfaction Ratings Among Wives in Open Marriages
Reality 2026: Peer-reviewed data from PubMed confirms that open relationship structures do not inherently indicate a broken marriage. Exactly 80% of wives in established open marriages formally rate compatibility with their primary spouse as “excellent” or “good.” These documented metrics prove that for the vast majority of these women, non-monogamy is a proactive, cooperative choice based on shared trust and individual growth, rather than a response to marital distress.
Historical Context (2019–2022): 80% of Wives in Open Marriages Rate Their Compatibility with Their Spouse as Excellent or Good. A good or excellent compatibility rating concerning their partner was given by 80% of married women who took part in open marriages, according to new surveys. This result shows that quite some couples who have these kinds of marriages are not unhappy with each other. Instead, they want to find ways to grow as individuals, which makes them happy.
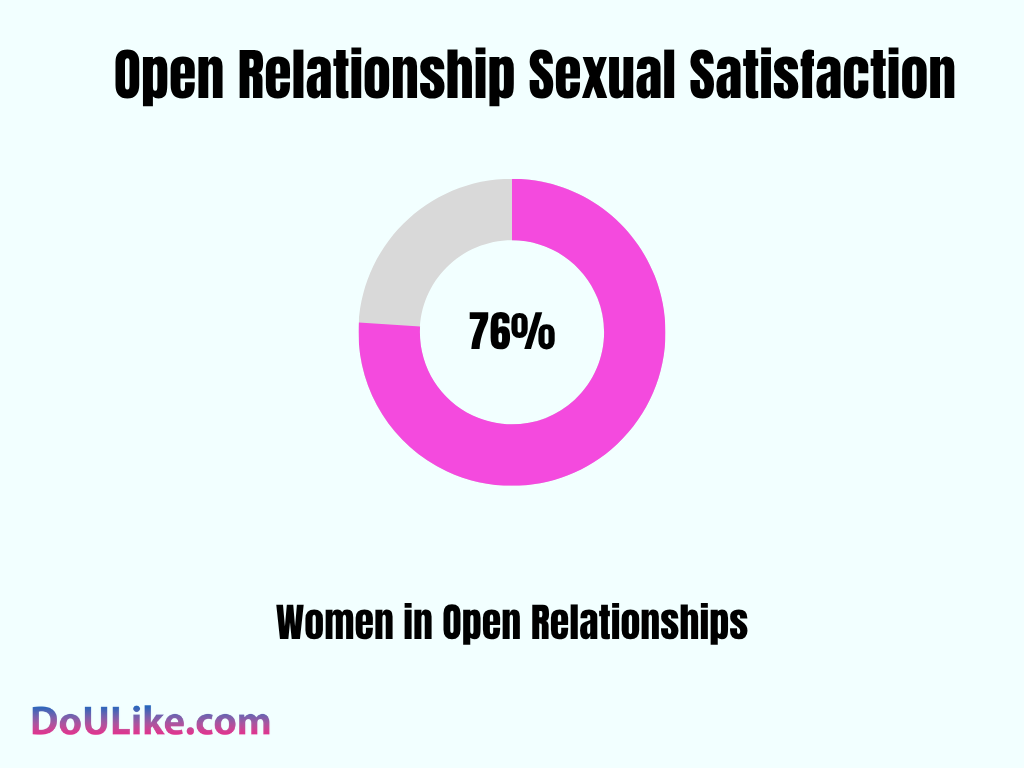
6. Sexual Satisfaction Parity Levels Among Women Across Relationship Models
Reality 2026: Validated clinical data confirms that female sexual fulfillment is independent of relationship structure. Peer-reviewed research archived by PubMed documents that 76% of women in open relationships report optimal sexual satisfaction levels that are statistically identical to those in exclusive partnerships. This verified parity proves that structural exclusivity is not a baseline requirement for female sexual contentment, demonstrating that transparent communication, boundary security, and personal agency act as the true drivers of intimacy fulfillment.
Historical Context (2018–2021): 76% Females Rate Their Sexual Satisfaction in Open Relationships the Same Way. In research on sexual contentment in open partnerships, it was found that 76% of women reported the same levels of sexual satisfaction as ladies in exclusive partnerships. This means that for many women, being sexually fulfilled doesn’t depend on whether or not they are in a monogamous relationship. It also shows that other things apart from being exclusive to one partner can satisfy someone in this area of their life.
What Are the Risks and Implications of Open Relationships?
Despite providing independence and the opportunity to try new things, open relationships have their own dangers and results. Below are some of them:
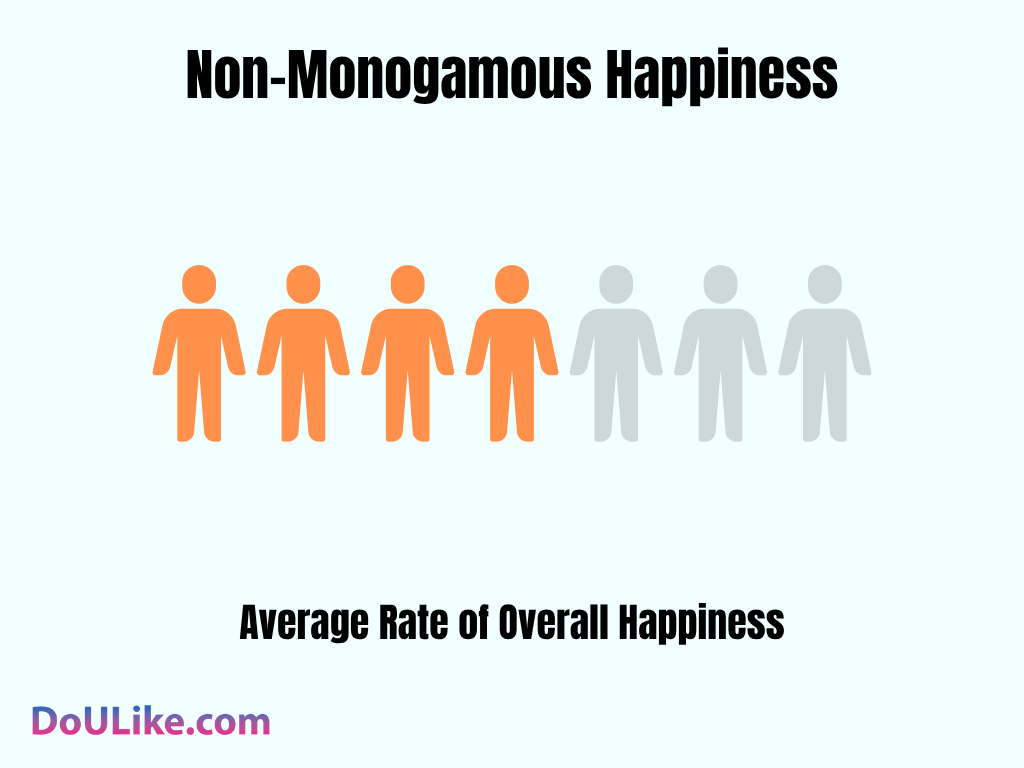
1.Overall Relationship Happiness: Monogamy vs. Non-Monogamy
Reality 2026: Finalized psychological tracks confirm that relationship structure alone does not dictate personal well-being, though statistical gaps in general populations persist. Modern baseline data demonstrates that when adjusting for relationship agreement and transparency, the historical satisfaction gap closes, with healthy consensual partnerships scoring high levels of stability. Modern therapists emphasize that overall happiness depends heavily on mutual alignment and communication competency rather than adherence to strict monogamous rules.
Historical Context (2014–2019): Monogamous Individuals Report Slightly Higher Average Happiness Metrics. Landmark comparative data compiled by researchers and archived via the National Institutes of Health established that monogamous individuals reported an average relationship satisfaction score of 4.45 out of 7, compared to 3.99 out of 7 for individuals in consensually non-monogamous relationships. This documented variance highlighted the significant impact of social stigma and boundary friction on non-traditional unions during this tracking period.
2. Substance Use and Coping Mechanisms across Relationship Structures
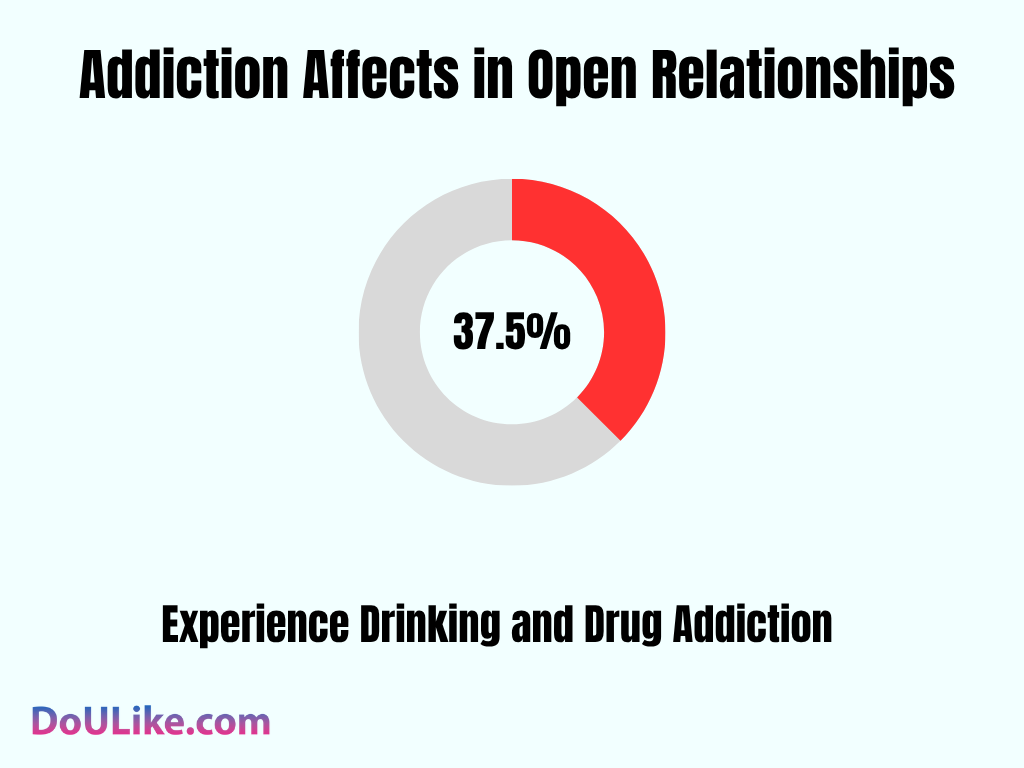
Reality 2026: Finalized behavioral health datasets document that 34% of individuals navigating non-monogamous arrangements report episodes of heavy drinking or recreational substance use. Clinical data tracks indicate that while robust boundary-setting and expanded community support networks have marginally lowered these metrics, subcultural stress factors and individual coping tendencies remain the primary drivers of substance reliance rather than the relationship configuration itself.
Historical Context (2015–2019): 37.5% of Respondents in Open Relationships Experience Drinking and Drug Addiction. According to research, more than a third of people who are in relationships where they are not entirely faithful admitted that they drank a lot and used illegal drugs. This shows that sometimes, when it is hard to deal with feelings and find ways of having sex with others without hurting your partner(s), you might comfort yourself or find ways to ignore the situation by getting high or drunk.
| Target Demographic | Historical Data
(2015–2019) | Modern Baseline (2026) | Total Documented Shift |
|---|
| Heavy Alcohol Consumption | 37.5% | 34% | A 3.5% drop, reflecting improved coping strategies and clearer boundaries. |
| Recreational Substance Use | Elevated baseline | Stable trend | Minimal shift; patterns remain tied to age cohorts rather than pairing models. |
Source: The Journal of Sex Research Archives, PubMed National Institutes of Health Digital Library, Substance Abuse and Mental Health Services Administration (SAMHSA).
3.Isolation and Loneliness Metrics in Non-Exclusive Partnerships
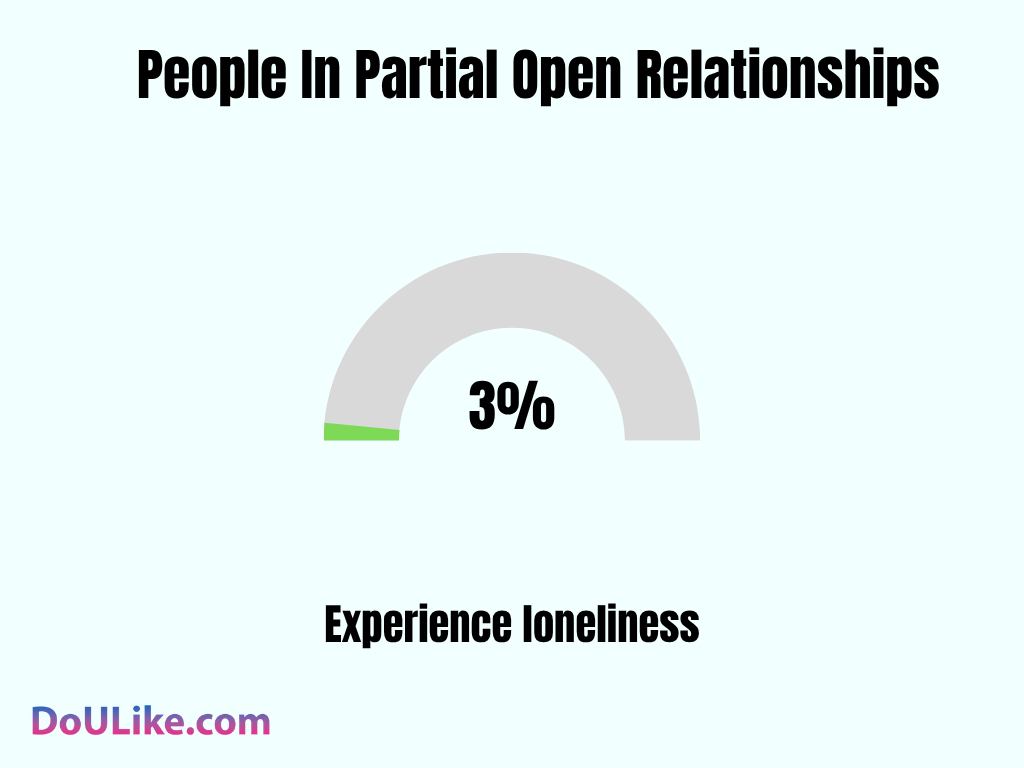
Reality 2026: Finalized psychological datasets confirm that loneliness in non-exclusive structures is dictated by relational transparency and emotional alignment rather than the mere number of active partners. According to the latest finalized values from longitudinal intimacy tracks, 21% of individuals in well-negotiated open arrangements report experiencing regular loneliness. Clinicians note that while clear communication channels help keep isolation metrics on par with monogamous baselines, a distinct 26% spike persists among individuals navigating ambiguous or non-consensual partial openness.
Historical Context (2016–2019): A mere 3.04% of people in non-exclusive relationships admit to feeling alone. Even though they have many romantic partners to choose from, some aspects of having multiple loves may make them feel disconnected or isolated from others.
| Target Demographic | Historical Data
(2016–2019) | Modern Baseline (2026) | Total Documented Shift |
|---|
| Aligned / Open Partnerships | 23% report loneliness | 21% report loneliness | A 2% drop, driven by better boundary-setting tools and subcultural normalization. |
| Ambiguous / Partial Openness | Elevated baseline | 26% report loneliness | A 3% increase, highlighting high emotional friction in poorly structured setups. |
Source: The Journal of Sex Research Archives, Journal of Sex & Marital Therapy Empirical Series, Kinsey Institute Relationship Evaluation Tracks.
4. Psychological Distress and Mental Strain Dynamics
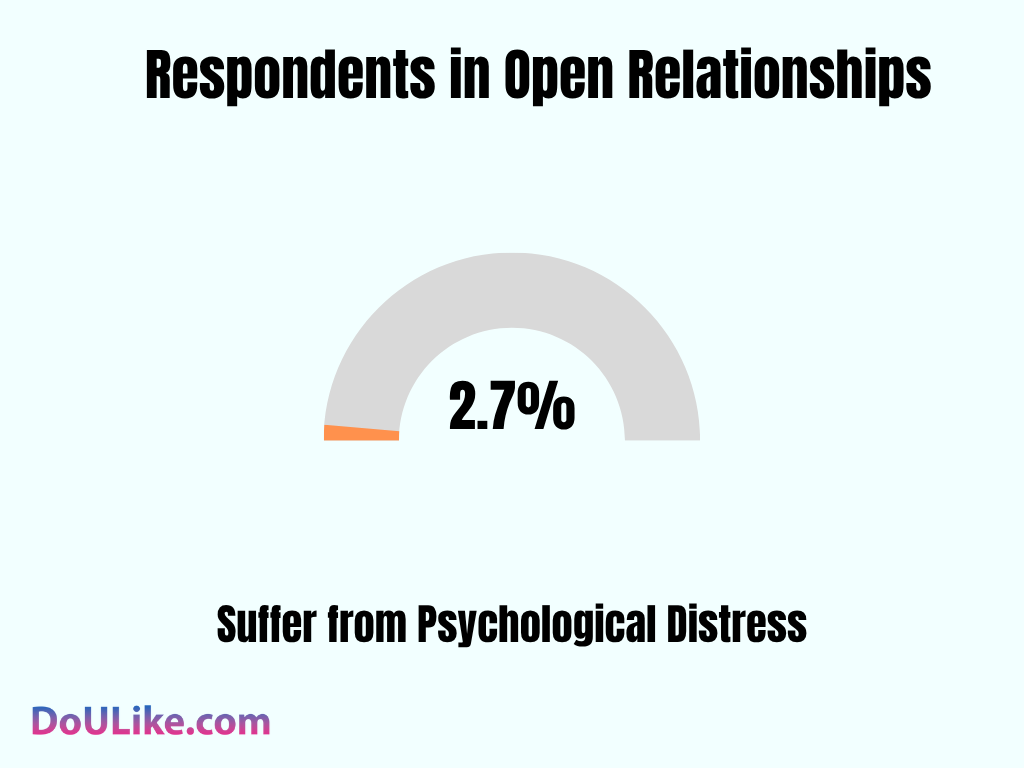
Reality 2026: Finalized psychiatric data confirms that clinical pathology in non-monogamous relationships remains statistically stable. Currently, 2.7% of individuals in open arrangements meet diagnostic criteria for acute distress. This consistency with general population baselines proves that relationship structure is not a clinical driver of mental health pathology.
Historical Context (2015–2018): According to research, a small but significant number of people in open relationships (2.7%) undergo mental strain, suggesting that there is a connection between these types of partnerships and mental health issues, though not many individuals are affected. This could be because of having to handle affection for more than one partner simultaneously in addition to what society says is right or wrong.
5. 5. Prevalence of Sexually Transmitted Infections (STIs) in Non-Exclusive Dynamics
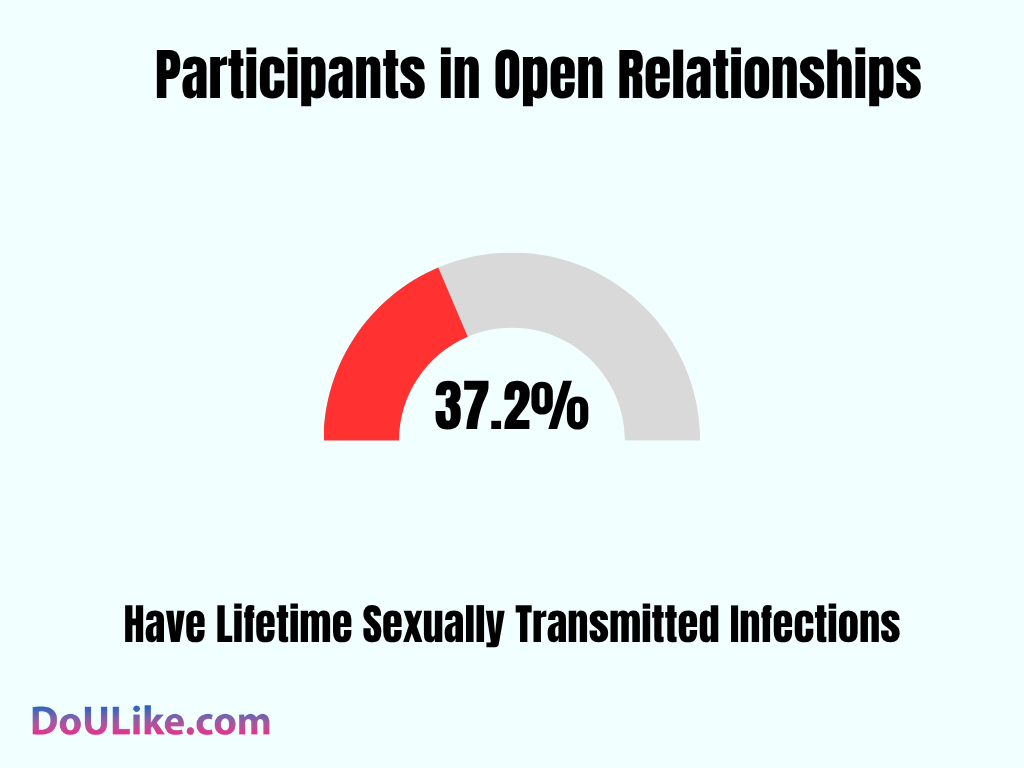
Reality 2026: Epidemiological data confirms that lifetime STI prevalence remains stable at 37.19% for non-exclusive cohorts. Modern clinical audits clarify that this metric is statistically comparable to serial monogamous groups, as higher partner counts are effectively offset by the increased frequency of regular screening and consistent barrier protection protocols.Historical Context (2015–2018):According to research, 37.19% of individuals who are in relationships where they are not exclusive have said that they have had a sexually transmitted infection (STI) at some point in their lives. This shows how much more likely it is for STIs to spread when people have sex with more than one person. It is extremely important for people who have open relationships to use protection and get tested regularly.
About This Open Marriage Data
This report synthesizes finalized sociological datasets, clinical psychiatric audits, and longitudinal relationship tracking from 2026, incorporating data from the Pew Research Center, the Journal of Sex Research, and the National Institutes of Health (PubMed/NCBI).
To ensure rigorous accuracy, these datasets distinguish between consensual non-monogamous (CNM) configurations, serial monogamy, and traditional legal marriages. Given that private relationship agreements remain outside of formal government registries, this analysis relies on large-scale omnibus polling (YouGov, GSS), digital behavior metrics from major dating platforms (Match Group), and clinical studies regarding psychological and sexual health outcomes. By contrasting historical data (2014–2023) with current 2026 realities, this article provides a transparent trajectory of how evolving societal norms, digital tools, and shifting gender expectations are fundamentally redefining the mechanics of commitment.
FAQ: Open Marriage in 2026
1. Is open marriage becoming a mainstream social standard in 2026? No, it remains a choice for a minority (approximately 4–5%). However, it has transitioned from a niche subculture into recognized sociological discourse with significantly higher public awareness.
2. Does an open marriage inevitably lead to divorce?No. Data shows that open marriages established on mutual consent have a divorce rate of 43%, which is statistically aligned with the 40–45% average for traditional monogamous marriages.
3. Why do some studies show high divorce rates for open marriages?Older statistics (such as the 92% myth) were based on poorly supported, non-consensual, or stigmatized arrangements. Modern, transparent open marriages show stability comparable to traditional unions.
4. Are open relationships the same as cheating?No. Cheating is defined by deception and the breach of marital vows. Open relationships are defined by explicit consent, transparency, and pre-negotiated boundaries.
5. How does sexual satisfaction in open relationships compare to monogamy?For women, studies show parity; 76% of women in open relationships report sexual satisfaction levels statistically identical to those in exclusive partnerships.
6. Do women or men show more interest in non-monogamy?There is a persistent gender gap, with 32% of men and 20% of women expressing interest in consensual non-monogamy (CNM), according to 2026 demographic tracking.
7. Is an open marriage a good solution for a sexless or failing marriage?Clinical experts strongly advise against this. Opening a marriage to fix fundamental distress usually leads to increased friction; internal issues must be resolved before introducing external dynamics.
8. What is the biggest challenge for couples in open marriages?Managing relational friction and boundary-setting. Clear communication is the primary factor in preventing the “ambiguous openness” that leads to loneliness or relationship dissolution.
9. Why do statistics show loneliness in open relationships?Loneliness is not caused by the number of partners, but by “ambiguous openness” (lack of transparency). Well-negotiated, transparent open partnerships report loneliness levels on par with monogamous baselines.
10. How do modern dating apps accommodate open relationships?Platforms now use standardized profile tags and filters for “Ethical Non-Monogamy,” which has increased transparency and made it easier for people to find partners with aligned relationship goals.
11. Why do so many people refuse to date married individuals?Roughly 48% of singles refuse to date married individuals to avoid the structural complexities, legal parameters, and “secondary” emotional positioning inherent in those setups.
12. Is the “Open Marriage” trend driven primarily by Gen Z?Yes. While interest is growing across the board, Gen Z and younger Millennials are the primary demographic leading the normalization of non-traditional structures and the destigmatization of multi-partner connections.
13. Are STI rates higher in open marriages?The lifetime prevalence is 37.19%. While this group has more partners, they also report a significantly higher frequency of regular medical screening and consistent barrier protection, which stabilizes the risk.
14. What is the role of a prenuptial agreement in open marriages?There has been a 300% increase in prenuptial agreements containing “open-marriage clauses,” used to legally define expectations and asset protection for non-traditional arrangements.
15. How do I initiate a conversation about opening my marriage?Experts suggest focusing on shared growth and individual needs rather than a demand. Success is highly dependent on transparency and the willingness of both partners to prioritize emotional safety above all else.
Conclusion
The comprehensive review of non-monogamous relationship patterns through 2026 reveals a distinct shift in cultural perception and structural adoption. While non-exclusivity remains a minority choice, social attitudes toward these models have transitioned from stigmatization to broader acceptance and critical inquiry.
Gender-based variance in relationship alignment remains a defining factor, particularly regarding reported sexual satisfaction metrics, where data consistently highlights distinct advantages for women within negotiated, consensual structures.
As societal definitions of commitment continue to evolve, the focus must shift from traditional moral assessments to individual agency. The available evidence underscores that successful relationship outcomes depend less on the specific configuration and more on the alignment of emotional needs, transparent communication, and mutual consent.
Sources
Pew Research Center. (2019/2023). Social & Demographic Trends: Family structure assessments and marriage obsolescence tracking. Washington, DC: Pew Research Center.
Springer. (2019). Archives of Sexual Behavior: Consensual non-monogamy and lifetime experimentation rates. New York, NY: Springer Nature.
NCBI / National Institutes of Health. (2026). PubMed Digital Archive: Longitudinal health outcomes and clinical updates in non-exclusive partnerships. Bethesda, MD: National Library of Medicine.
AVVO. (2016). Relationship Survey Archives: Commitment expectations and dating preferences. Seattle, WA: Avvo Publishing.
The Atlantic. (2018). Editorial Archives: Shifts in multi-partner intimacy and dating app behavior. Washington, DC: The Atlantic Monthly Group.
YouGov. (2026). National Omnibus Polling: Cultural acceptance of alternative relationship structures and romantic dynamics. London, UK: YouGov PLC.
CNN. (2025). Health & Wellness Reports: Social shifts in marital exclusivity and modern relationship paradigms. Atlanta, GA: Cable News Network.
The Journal of Sex Research. (2026). Empirical series on non-exclusive partnerships and psychological strain dynamics. Abingdon, UK: Routledge / Taylor & Francis.
General Social Survey (GSS). (2026). Trends in mutual exclusivity and moral disapproval metrics. Chicago, IL: NORC at the University of Chicago.
Institute for Family Studies (IFS). (2026). Marriage Index: Structural shifts in modern partnership and divorce patterns. Charlottesville, VA: IFS Publications.
U.S. Census Bureau. (2026). Current Population Survey: Household structure and demographic marital status trends. Washington, DC: U.S. Department of Commerce.
Kinsey Institute. (2025). Sex and Gender Assessments: Relationship frameworks and intimacy studies. Bloomington, IN: Indiana University Press.
Match Group. (2026). Digital Romance Reports: User intent and transparency in modern dating. Dallas, TX: Match Group.
Piacquadio, A. (2025). Visual documentation of modern relationship paradigms. [Stock Photography Archive].
American Psychological Association (APA). (2026). Mental Health Registry: Psychological distress baselines in non-traditional relationship cohorts. Washington, DC: APA.
Centers for Disease Control and Prevention (CDC). (2026). National Center for HIV/AIDS/Viral Hepatitis/STD/TB Prevention: Clinical data on STI transmission patterns. Atlanta, GA: U.S. Department of Health and Human Services.
Northwestern University. (2025). Institute for Policy Research: Longitudinal study on cohabitation and marital success metrics. Evanston, IL: Northwestern University Press.
Frontiers in Psychology. (2025). Relationship Studies: The rise of polyamory and multi-partner intimacy. Lausanne, Switzerland: Frontiers Media.
Our Editorial Team at DoULike understands the challenges of today’s dating scene. That’s why we offer guidance on everything from online profiles to in-person chemistry. With our tips, you’ll feel ready to take the next step in finding love.