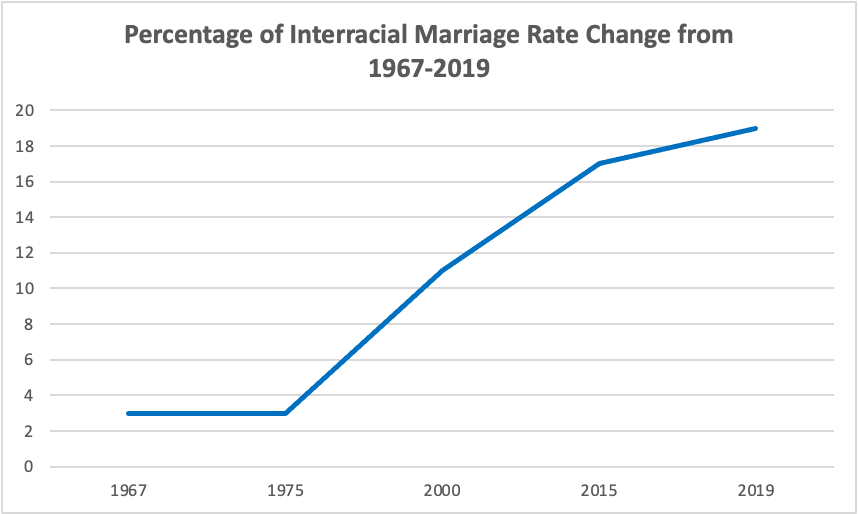
The percentage of interracial marriage among newlyweds increased to over six times from 1967 to 2019. According to the Pew Research Center, the share of newlyweds married to a spouse of a different race shows a steep rise from 3% in 1967 to 19% in 2019.
Of all married U.S. adults in the recent year, 11% had a partner different from their race. This percentage is higher than the United States Census report of 7.4% in 2000 to 10.2% from 2012 to 2016.
Interracial Marriage Facts in 2019:
| ■ 29% of Asian newlyweds and 27% of Latino newlyweds are married to their spouses from a different race or ethnicity. more>> |
| ■ The most common racial or ethnic pairing of interracial couples is a Hispanic and white spouse at 42%. White and Asian spouse follows it at 15% and White and Multiracial spouses at 12%. more>> |
| ■ 46% of the US-born Asian and 39% of Hispanic newlyweds had chosen a spouse who is not their race. more>> |
| ■ Compared to only 5% of Black people who reported interracial marriage in 1980, it increased to 18% today. White men and women were least likely to report interracial marriage at 11%. more>> |
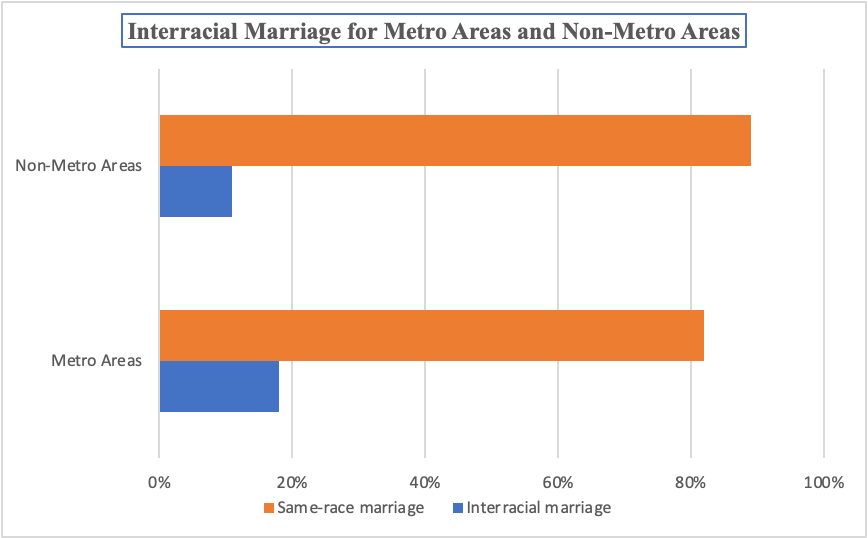
| ■ Interracial marriage in metropolitan areas is higher by 7% percent than in non-metropolitan areas. more>> |
DoULike Statistics on Interracial Match Behavior
Alongside official marriage statistics, observed dating patterns help reveal how interracial relationships form before marriage. Data from DoULike shows clear behavioral differences in interracial matches compared with same-race matches.
Key DoULike findings from 2025:
- 62% of interracial matches involve users reading a partner’s profile thoroughly before sending a first message (vs. 47% for same-race matches).
- 54% of interracial conversations continue beyond five message exchanges, compared with 38% of same-race threads.
- 29% of interracial matches include intentional discussions about culture or family within the first week, versus 15% for same-race matches.
- 46% of interracial pairs schedule an in-person date after at least 8 weeks of chatting, while only 31% of same-race pairs wait this long before meeting.
- 71% of interracial couples maintain active communication for more than three months, compared with 58% among same-race couples.
These percentages indicate that interactions leading to interracial marriage may involve deeper engagement and longer early-stage communication than typical dating app matches.
Interracial Marriage Rates Change among Newlyweds
The interracial marriage rate changed to a significantly higher percentage which increased over five times after the marriage of Mildred Loving, a part-Native American, a part-black woman, and her husband, Richard Loving, which led to the 1967 U.S.
Supreme Court ruling that legalized Interracial marriage in the country. According to the Pew Research Center report, the share of newlyweds married to a spouse of a different race or ethnicity shows a steep rise from 3% in 1967 to 17% in 2015 and 19% in 2019.
Figure 1. The rate of interracial newlyweds’ changes
 Source of data: https://www.npr.org/sections/codeswitch/2017/05/18/528939766/five-fold-increase-in-interracial-marriages-50-years-after-they-became-legal
Interracial marriages among newlyweds increased to 19% in 2019, 2% higher than the report in 2015 that one in six newlyweds, or 17% of couples, were married to someone of a different ethnicity. It may not sound like a lot, but it amounts to above 11 million people in total who are involved in interracial marriages. This increasing number is not only African Americans and Caucasians but also Asians and Hispanics.
29% of Asian and 27% of Latino Newlyweds are Married to Spouses from a Different Race
Figure 2. Marriage Rates of Newlyweds by Race and Ethnicity

 Source of data: https://www.pewresearch.org/social-trends/2017/05/18/1-trends-and-patterns-in-intermarriage/
* This number is even higher among these racial groups when they are US-born. Hispanic and Asian newlywed couples are more likely to marry someone from another race/ethnicity if they were born in the US rather than abroad! 46% of Asian and 39% of Hispanic marry outside their ethnicity when they are U.S.-born, compared to only 24% of Asians and 15% of Hispanic when immigrants form.
US-born Asians and Hispanics are more likely to marry another race than immigrants.
Racial and Ethnic Profile of Interracial Marriage Couples
Interracial marriage in the USA varies on racial and ethnic profile. There’s a dramatic increase in interracial marriages for Blacks and White couples. The share of the recent findings of married Blacks to a spouse of different ethnicity has tripled from 5% in 1980 to 18% in 2015, while the recently married White have a double rate from 4% to 11%.
Black interracial marriages raised from 5% in 1980 to 18% in 2015. White Doubled from 4% to 11%.
Figure 3. Black and White Couple and Recently married White to Other Race.

 Source of data: https://www.pewresearch.org/social-trends/2017/05/18/1-trends-and-patterns-in-intermarriage/
Furthermore, the couple combinations of interracial marriages consist of eight types, and the most significant combination is White and Hispanic at 42%. It is followed by White and Asian couple at 15%. In contrast, only 3% are Hispanic couples and Multiracial and Hispanic and Asian.
The Most Significant Interracial Marriages Combination is White and Hispanic at 42%.
Figure 4. Combination of Ethnicities among Interracial Couples

 Source of data: https://www.pewresearch.org/social-trends/2017/05/18/1-trends-and-patterns-in-intermarriage/ * Note: 22% of couples include a White husband and a Hispanic wife, and 20% have a White wife and a Hispanic husband, which gives a 42% share of an interracial couple in this combination.
Interracial Marriage by Age Group
About one in five newlyweds, or 18% of individuals in their 30’s, were married to a different race. 16% of those in their 20s and 40s, but among newlyweds aged 50 and above, the share percentage is 13%. According to Pew Research Center, this data from the 2015 survey can be attributed to the lower rate of women. Nevertheless, research suggests that interracial marriage did not vary substantially by age.
Figure 5. The Newlyweds among Age-groups

 Source of data: https://www.pewresearch.org/social-trends/2017/05/18/1-trends-and-patterns-in-intermarriage/
Interracial Marriage by Educational Attainment
The likelihood of interracial marriage increases as individuals move up the educational ladder. According to the Pew Research center, interracial marriage rises more for those with at least some college experience.
Based on the statistics from the 19th century, only 14% of the less-educated group have spouses of a different racial group. But, the data for individuals with some college experience rose to 18%, while 19% for those with at least a bachelor’s degree. These statistics yield a similar result in 2015, whereas 13% of the newlywed’s men and 14% of the women have high school diplomas while 19% of recently married men and 18% of women have some college experience while 20% of men and 18% women newlyweds have bachelor’s degree.
Figure 6. Interracial Marriage by Educational Attainment

 Source of data: https://www.pewresearch.org/social-trends/2017/05/18/1-trends-and-patterns-in-intermarriage/
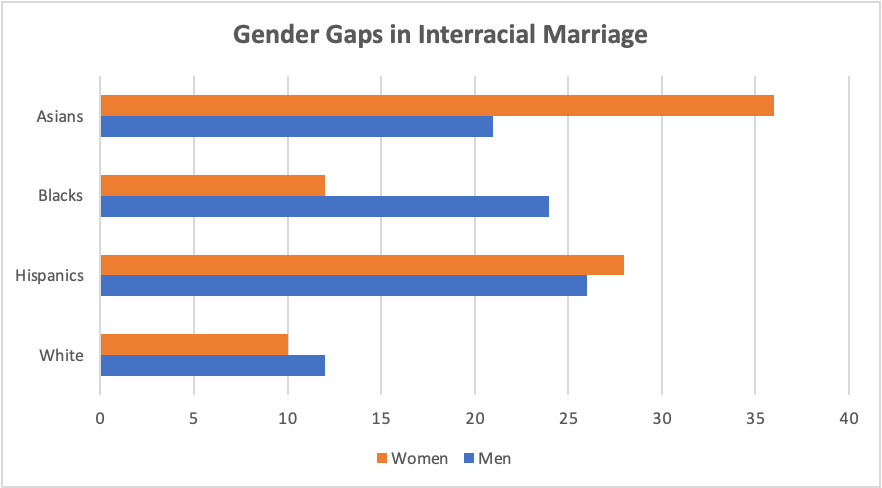
Although there are no overall gender differences in interracial marriage among newlyweds, gender patterns emerge for some racial groups.
Figure 7. The Gender Gaps of Interracial Marriage
 Source of data: https://www.pewresearch.org/social-trends/2017/05/18/1-trends-and-patterns-in-intermarriage/
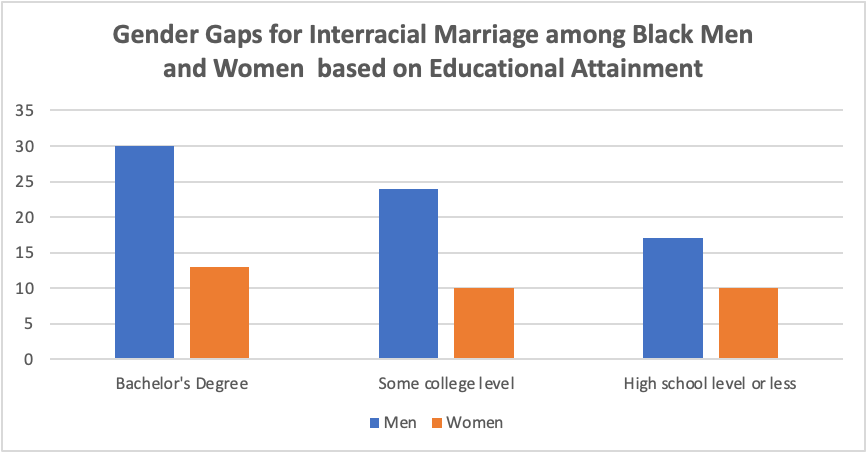
Interracial marriages are more common among college-educated Black men. But, among Black people, the gender gap in interracial marriage is higher for those men with some college education or degree compared with black women who married other races.
Figure 8. The Gender Gaps of Interracial Marriage among Black people
 Source of data: https://www.pewresearch.org/social-trends/2017/05/18/1-trends-and-patterns-in-intermarriage/
Interracial Marriage for Metro Areas and Non-Metro Areas
There’s a vast variation of interracial marriage in Metro and Non-Metro Areas in the United States. Interracial marriage is more common in metropolitan areas than in more rural and non-metro regions. For comparison, the interracial marriage in metro areas is 18% higher than the results in non-Metro areas, which is 11%. To illustrate the difference in percentage, this pie chart
The Interracial Marriage in Metro Areas is 18% Higher than the Results in non-Metro Areas, which is 11%
Figure 9. Interracial marriage in Metro and Non-Metro Areas
 Source of data: https://www.pewresearch.org/fact-tank/2017/05/18/in-u-s-metro-areas-huge-variation-in-intermarriage-rates/
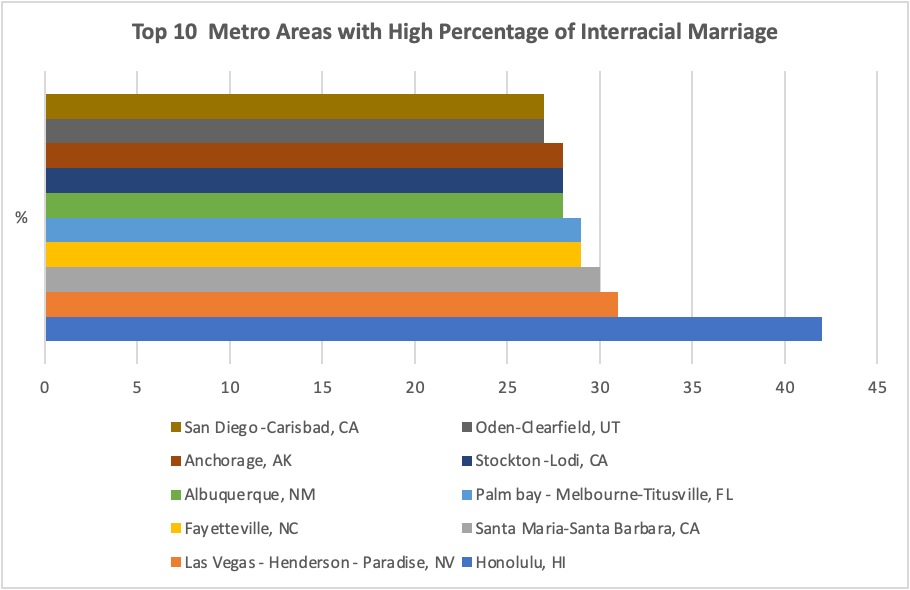
Interracial marriage within the metro areas differs across races. For example, among the newlyweds in Chicago, 35% of Asians are married to someone of a different ethnicity, compared with 24% of Hispanics, 14% of Whites, and 13% of Blacks. By far, the highest of all metro areas analyzed goes to Honolulu, with a share of 42%. The same is true in Las Vegas or Santa Barbara, California, where three in every ten newlyweds are married to a spouse with a different racial group.
Figure 10. Metro Areas with High Interracial Marriage
 Source of data: https://www.pewresearch.org/fact-tank/2017/05/18/in-u-s-metro-areas-huge-variation-in-intermarriage-rates/
Some of the metro areas shown in Figure 6 have relatively little racial and ethnic diversity, contributing to the low rate of interracial marriage. For example, in Asheville, 85% of the potential spouses’ pool is White; in Youngstown, 79% of the marriage market is composed of Whites and another 15% of Blacks. However, this is not the case in Jackson, where the pool of potential spouses comprises 61% non-Hispanic Blacks and 36% non-Hispanic Whites, and 37% non-Hispanic Blacks.
The factor contributing to the low interracial marriage rates in these areas is the low acceptance rate. For example, 13% of adults from the South say interracial marriage is bad for society, while 11% from the Midwest, where Youngstown is located, say the same thing. But, in comparison, a smaller share in the West, at 4%, and 5% from the Northeast say that interracial marriage is bad for society (See discussion of interracial approval rate).
Figure 11. Interracial Marriage Non – Acceptance Rate by Region

 Source of data: https://www.pewresearch.org/fact-tank/2017/05/18/in-u-s-metro-areas-huge-variation-in-intermarriage-rates/
Figure 12. Metro Areas with Least Interracial marriage

 Source of data: https://www.pewresearch.org/fact-tank/2017/05/18/in-u-s-metro-areas-huge-variation-in-intermarriage-rates/
Interracial Marriage Divorce Rate
Interracial marriages have been known to have a higher divorce rate than expected, but they vary in age, race, and sex. A person’s age in an interracial marriage divorce rate is one factor for divorce. In 2018, there was one divorce for every 14 marriages among the ages 15 to 24 years old. But, those aged 45 to 54 and 55 to 64 have less divorce rate and fewer marriages, while those 65 and older had more divorces than marriages. Among all these age groups, only two have higher divorce rates: women aged 15 to 24 and 65 years over, which is higher than the marriage rate for the year.
Figure 13. Marriage to Divorce Rate by Age

 Source of data: https://www.bgsu.edu/ncfmr/resources/data/family-profiles/schweizer-marriage-divorce-ratio-demo-variation-fp-19-27.html
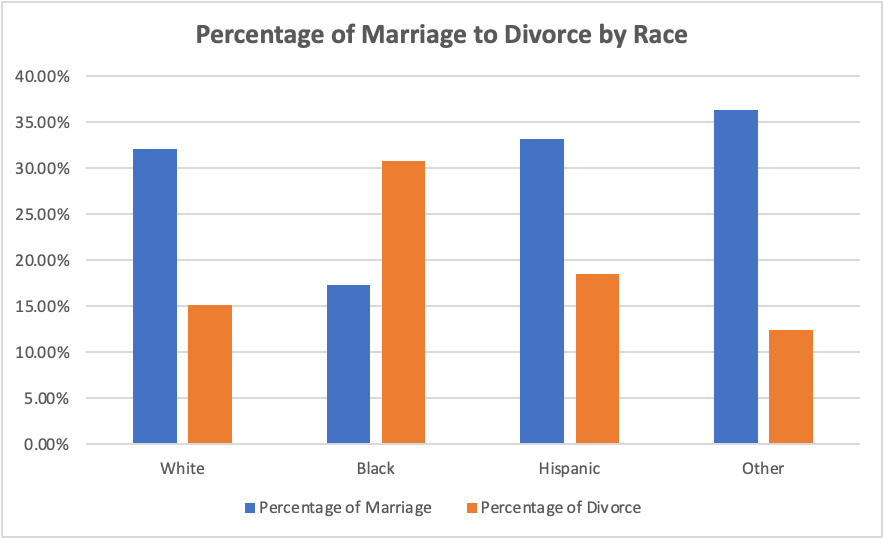
Interracial marriage for Other races, including Asian, Indian, American, Alaska Native, and multi-racial women, had the highest marriage-to-divorce ratio in 2018, but looking at the divorce rate alone, it is the least. Nevertheless, this percentage means that out of three women, one of them gets divorced. According to Discover Magazine, when the wife is White, a spouse of another race shows a higher divorce rate but not that high for White husbands and other races of wives. Furthermore, interracial marriages involving Black husbands or wives show the highest percentage of divorce over marriages.
Figure 14. Marriage to Divorce by Race
 Source of data: https://www.bgsu.edu/ncfmr/resources/data/family-profiles/schweizer-marriage-divorce-ratio-demo-variation-fp-19-27.html
Interracial Marriage Approval
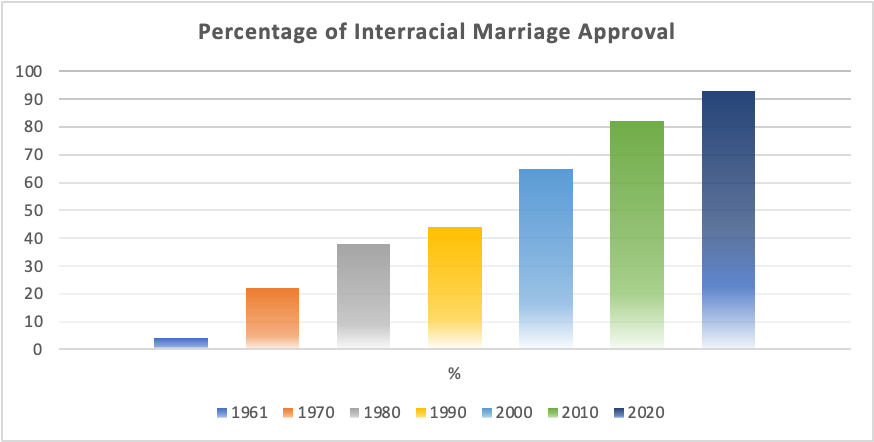
According to Gallup, 94% of the adults in the United States now approve of interracial marriages, which is higher than the 87% reading in 2013.
Based on the figure released by Gallup, the US adults’ approval percentage from 1958 to 2021 marks a high rate. It has been the most significant transformation so far in public opinion, beginning the time of interracial marriage in the USA.
Figure 15. Interracial Marriage Approval from 1960-2021
 Source of Data: https://www.axios.com/2022/09/07/approval-of-interracial-marriage-america *Approval of marriage between black people and white people and nonwhites
This approval rating is sky-high, no matter how you slice the data.
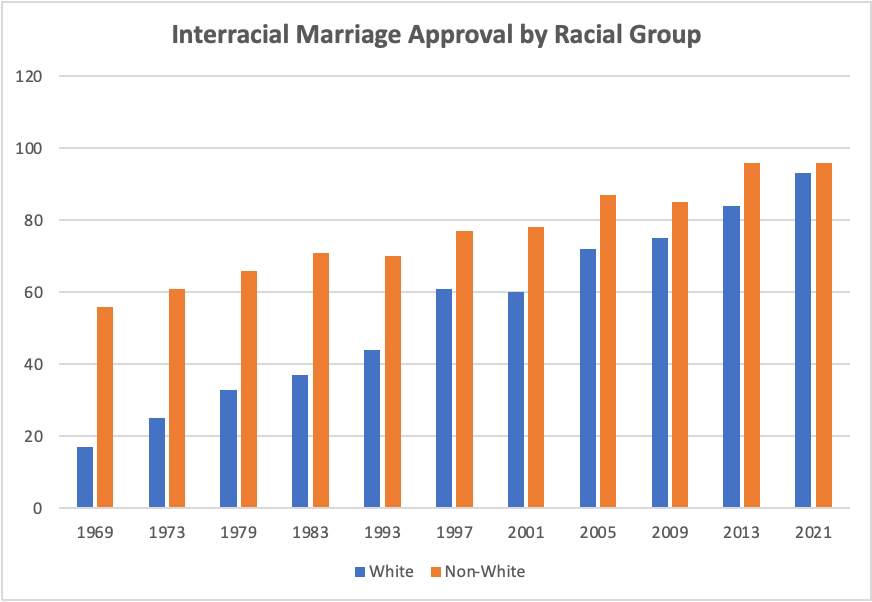
- 96% of non-White Americans and 93% of White approve the interracial marriage.
- About 49% of the Democrats and Democratic-learning Independents say interracial marriage is good for society. In comparison, only 28% of the Republicans and Republican-learning independents say so (See discussion of positive and negative effects of Interracial Marriage).
- Non-White Americans have been consistently more supportive of interracial marriages than white Americans in the past decades. Still, the gap is narrowed over time and was closed in the latest survey.
- The previous measures show from 1968 to 2013 that, there was a double-digit gap in approval between White (93%) and Non-White adults (96%).
- In the latest survey of Gallup in 2021, three percentage points separate the approval between White and Non-White adults.
- Since the year 1968, the majority of non-White adults have approved the interracial marriage, and it was until 1997 that majority of the White held the same opinion.
Figure 16. Approval of Interracial Marriage by Race
 Source of Data: https://news.gallup.com/poll/354638/approval-interracial-marriage-new-high.aspx
Differences in Views on Interracial Marriage Decrease for All Generations
Over the last several decades, the American public has grown in accepting interracial marriage. 98% of 18-29 years old approve of interracial marriage, 97% are 30-49 years old, and 91% are 50 years old. Here’s the percentage of approval by age group.
Figure 17. Approval of Interracial Marriage by Age Group

 Source of Data: https://news.gallup.com/poll/354638/approval-interracial-marriage-new-high.aspx
A recent report by the Pew Research Center states that most Millennials, regardless of race, say that they are okay with a family member’s marriage to someone of a different ethnic group or race. Roughly nine in every ten say that they are fine with a family member’s marriage to Asian American (93%), White American (92%), Hispanic American (91%), African American (88%), and all other groups (85%). This high acceptance among millennials holds across ethnic and racial groups.
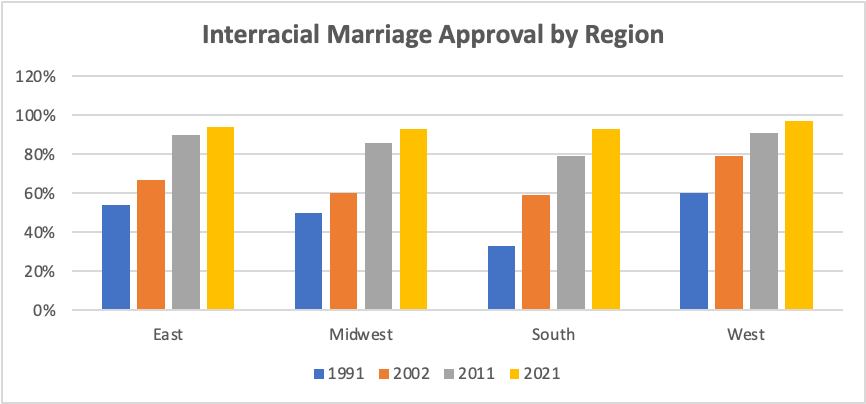
Differences in Views on Interracial Marriage for Regions is Gone Now
In the past decades, Americans from the East, Midwest, and West were very approving of the marriages of Black and White people compared with those living in the South. However, the current trend shows interracial marriage approval nearly universally the same, almost closing the regional gaps that existed in the early parts of the trend. Now, the percentage of approval based on regions is high.
Figure 18. Approval of Interracial Marriage by Region
 Source of Data: https://news.gallup.com/poll/354638/approval-interracial-marriage-new-high.aspx
Factors that contribute to the Rise of Interracial Marriage
Many factors contribute to the rise of interracial marriage in the USA. The Guardian reports:
- The acceptance of interracial couples has grown steadily.
- America is increasingly diverse and is projected to have a majority-minority population by 2045, increasing the diversity of potential romantic partners.
- Younger Americans are more educated than ever. Studies show a higher rate of interracial marriage among those with more education.
- After 55 years of the legalization of interracial marriage, Americans unanimously approve of love across races.
Positive and Negative Effects of Interracial Marriage
Today, interracial marriages are credited with many positive and negative effects both on individuals and society. As noted in history, laws, and court cases, these effects have been wrought by hardships and trials faced by brave men and women. Through the hard times and the years of trailblazing, the individual in the 21st century is experiencing some outcomes that prove to be beneficial.
| Positive Aspects | Negative Aspects |
Growing number of marriages
Interracial couples statistics have incessantly shown us growth since 1967, according to the Pew Research Center. This signals both acceptance, increased education level, and resulting demographic changes. | Isolation in some regions
In some regions, interracial relationships may not be supported. Thus, two loving and caring people might feel isolated from a community and be against the world. |
Cultural enrichment
A successful interracial marriage helps people overcome stereotypes and prejudices as it enriches them culturally and mentally. Together, partners form a new, exciting reality based on the combination of cultures, resulting in the synthesis of something special. | Lack of background
Interracial couples, though, may feel a lack of background in many questions, like raising kids, celebrations of holidays, and traditions. It can be difficult to find out the way. |
Unique reality
Partners in interracial marriage may boast of greater devotion to each other. The partners experience prejudice, discrimination, and misunderstanding, so staying together, they speak of their readiness to be together no matter what and a higher level of conflict resolution skills. | Identity complexities
Relationships, in general, may be the reason people ask themselves who they are. Identity complexities in interracial marriage may be caused by the pressure of new or old communities, which is challenging and hardly possible without the support of a specialist and beloved people. |
I am Linda Bunnell, freelancer and Relationship Expert.